Hello,
I finally was able to connect 4 JS220 and run them at the same time. I am recording at a sample rate of 100Hz. With one or two JS220 selected, the file size is what I would expect - not so large, but as soon as I connect a third JS, the interface jumps and the sample rate seems to switch to 1MHz causing the file size to grow exponentially (and eventually filled my drive). A. is there a way around this and B. is this a bug?
TIA
cherkey
Hi @cherkey - 100 Hz should definitely work with 4 JS220’s connected. You do need to ensure that you configure each and every JS220 for 100 Hz, though. The settings are all independent. You should be able to inspect the settings using the Device Control widget.
What do you mean by “the interface jumps”? What version of the Joulescope UI are you using?
Also ensure that your four Joulescopes are connected to a powered hub rated for at least 2A @ 5V total. If you have other devices connected, ensure that the hub has sufficient power for them, too. An unpowered hub will likely not be able to supply sufficient power causing Joulescopes to brown out.
Can you also submit an Issue Report through the UI? Select Help → Report Issue. In the notes, add a link to this topic so that we can respond accordingly.
Hi,
Yes, each device is set to 100Hz. I am using a powered USB hub. UI version is 1.7.7. What I i mean by ‘jumps’ is that the run starts with streaming (which I use to verify everything is running correctly and is then turned off during long recording) and waveform data is being displayed, the screen restarts (jumps not the best word I guess lol) as if a setting was changed.
I will submit thru Help/Report Issue
Thank you,
Hi @cherkey - We received the Joulescope UI issue report. Was this from the same computer you used for the 4 x JS220 capture? The logs shows no Joulescope ever connected and Joulescope UI 1.7.0 (not the latest 1.7.7). Unfortunately, this issue report does not have any meaningful info to help troubleshoot what you are seeing.
If you have Python 3.12+ and the latest pyjoulescope_driver installed, you can also try:
python -m pyjoulescope_driver record --frequency 100 out.jls
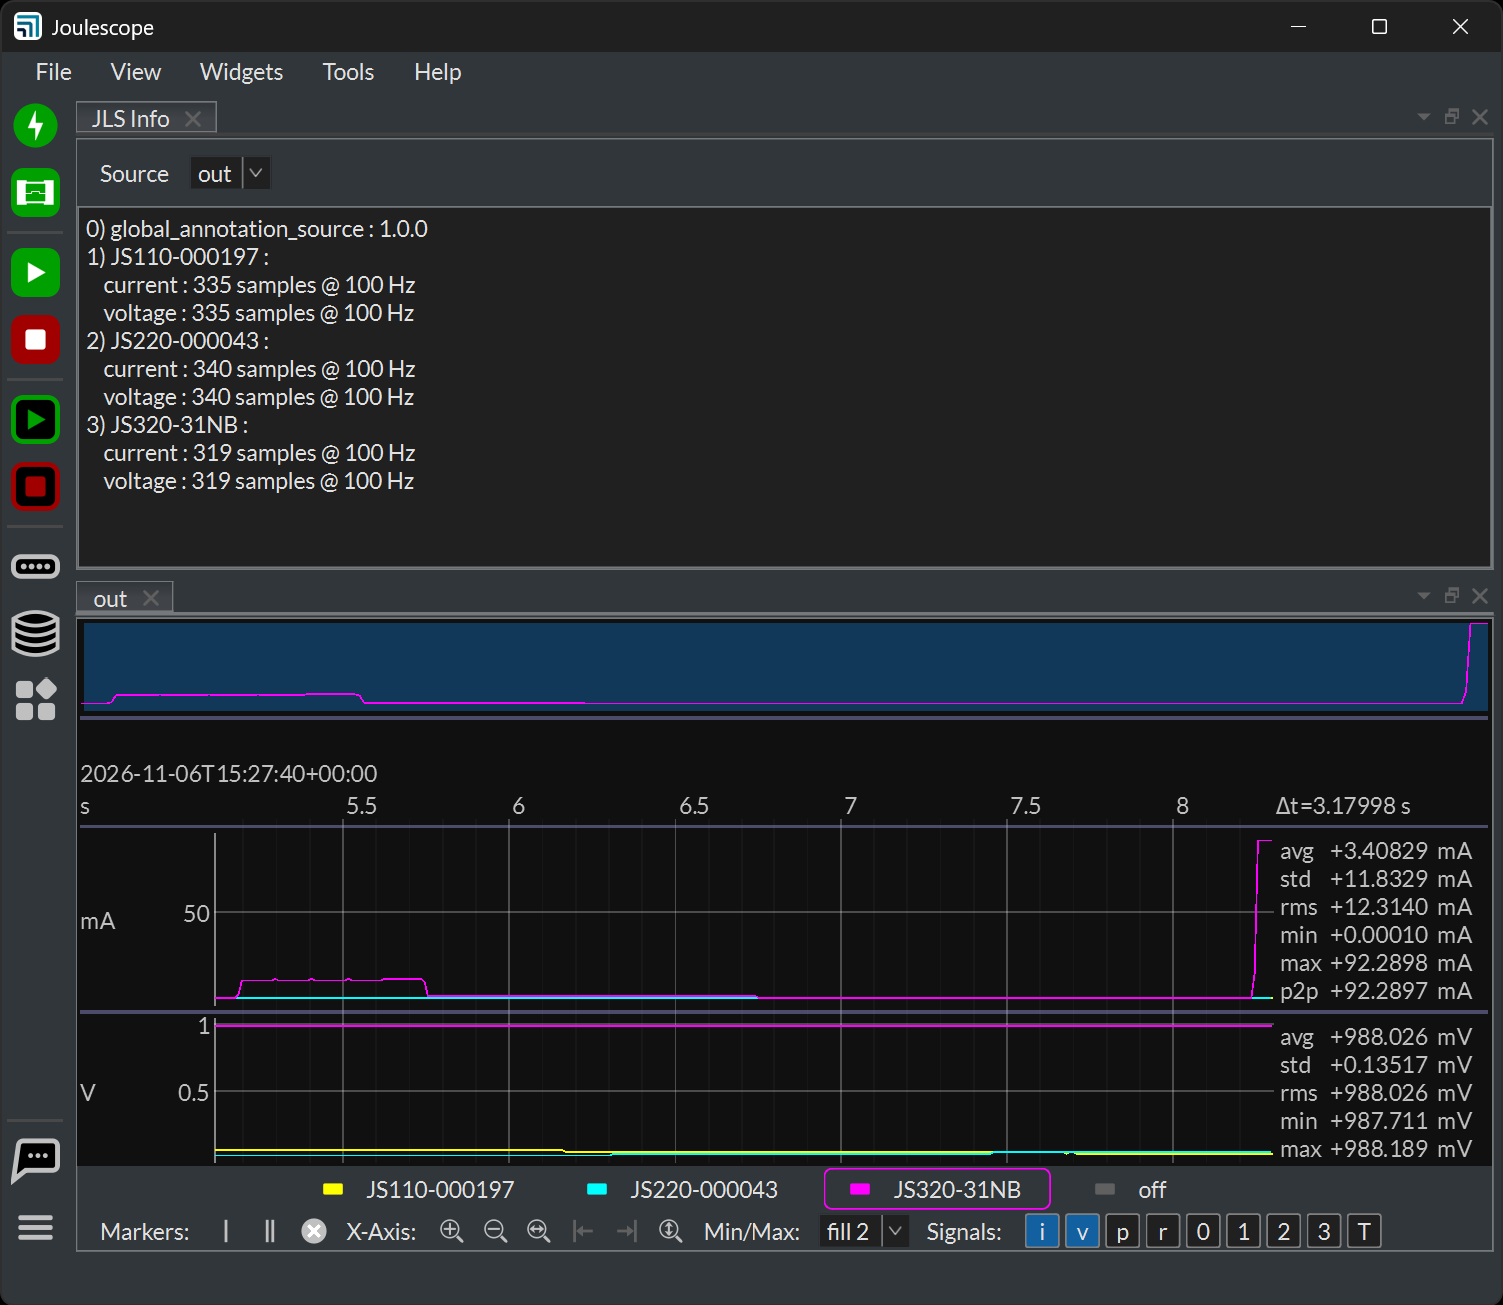
Here’s what I see in the Joulescope UI when viewing a very quick record with this method and adding the JLS Info widget:
Ah geez, my apologies, I had that other machine running with 2 JS only so I could keep the test running.. and sent the issue report with my other laptop, not thinking it would pull in all info from this one - I should’ve known.
I can follow up with that machine when the test is complete - as this is Friday, my reply will be Monday