Hello,
i where doing a three day 10kHz measurement that resulted in deed in a 35GB JouleScope Log file. If I try to open it, it takes a very long time until I get the first rougth view of the measurement.
And If I try to zoom in very close, so I have only 1 second on my screen, it takes a lot of time.
Is there a way to slice the measurement file in peaces, that could be loaded faster?
Is there a way to configure a sliced logging, so that after a certain amount of data a new file is started?
And one other thing, when I do such a long measurement, it sometimes would be good to freeze the screen and then operate on the buffer, still running the logging in background further. Is such a feature planned?
Your Joulescope can certainly capture a lot of data. The log file format has been designed to allow for terabytes, but that does sacrifice some performance. Are you recording to a traditional spinning Hard Disk Drive (HDD) or a Solid State Drive (SSD)? If you are using a HDD, an SSD will be much faster, not too expensive, and 36GB is not too big for an SSD.
We do not have a feature to slice a capture into multiple files, and we do not have this feature planned. Unfortunately, slicing the capture would likely create more problems for many Joulescope customers. However, when you find data of interest, you can export that data to its own file. Here’s how:
Right-click on the x-axis
Select Annotations → Dual Markers
Left-click and drag to position the markers
Right-click on one of the dual markers
Select Export data
We do have an item on our list to continue to improve JLS read performance. The existing JLS read code is in Python, and which we can likely substantially improve. If anyone reading this agrees that this should be a priority, comment below!
We do not have a feature to freeze the screen and navigate during a capture. Unfortunately, this feature would be difficult to implement, given the existing architecture. I can see how this would be valuable. The closest solution I can think of is to use dual markers to select the region and export it while the capture is still running. You can then open another Joulescope UI instance and load the JLS file. We did not design for this use case. However, I just tried it, and it seems to work. Does this work for your case?
thanks for the quick answer.
To the first element: Sad to hear that nothing is planned in this direction.
I already have a SSD and even with this, the procedure you explained and I already work with before, consumes much patience. Such a feature could be a option in the preferences to have a limit in logging time or in size, when the logging is storing data on the log/disk until a new file starts. So that could also be left unlimited for those how needed it and prefer it.
Is there a python script that could also extract the data, so I could use that for slicing the logging in more files?
To the second element: It depends on the logging and buffering time. For my use case this is hard to grab. But I keep you hint in mind. Thanks for that.
A third thing that would be nice: If in due to the big logging file size the UI needs long computation/loading/operation time, that is not seen anywhere. There could be a status, that something happens in background and the UI is not hang. For my feeling I zoom into the signal and only the few loaded and computed samples are still shown, and when after a long while (1 min) I see the newly loaded sample and therefore more signal details. But no indication during that time. (That also happens if I try a histogram on such data. After 5min I gave up and closed the UI, I don’t see if it is still doing something.)
A fourth thing : If a logging file is loaded it would make sense to reset or show indication messages within the “single value” windows of the UI, they keep the last value from a valid measurement if the device is also connected on the PC, and at the beginning this is always misleading. (Even with knowing it after sometime, I still get misleaded in the beginning.)
Hopefully, I am following along with the different topics. Let me know if I missed something!
1. Slicing recordings
The right answer here is to make JLS reading faster so that you don’t have to worry about it! We understand that some patience is required with the existing 0.9.1 software for very long captures, and the UI does not give an indication of loading progress.
1a. Tools to process JLS files
While we do not have any automatic slicing tools, you can write your own in Python. I just realized that we do not have an example under the pyjoulescope_examples repo. However, you can find an example in pyjoulescope in the recording entry point.
2. Exploring data while capturing
Understood. The problem here is that we cannot store all data to RAM, so this is challenging technically.
3. JLS read progress
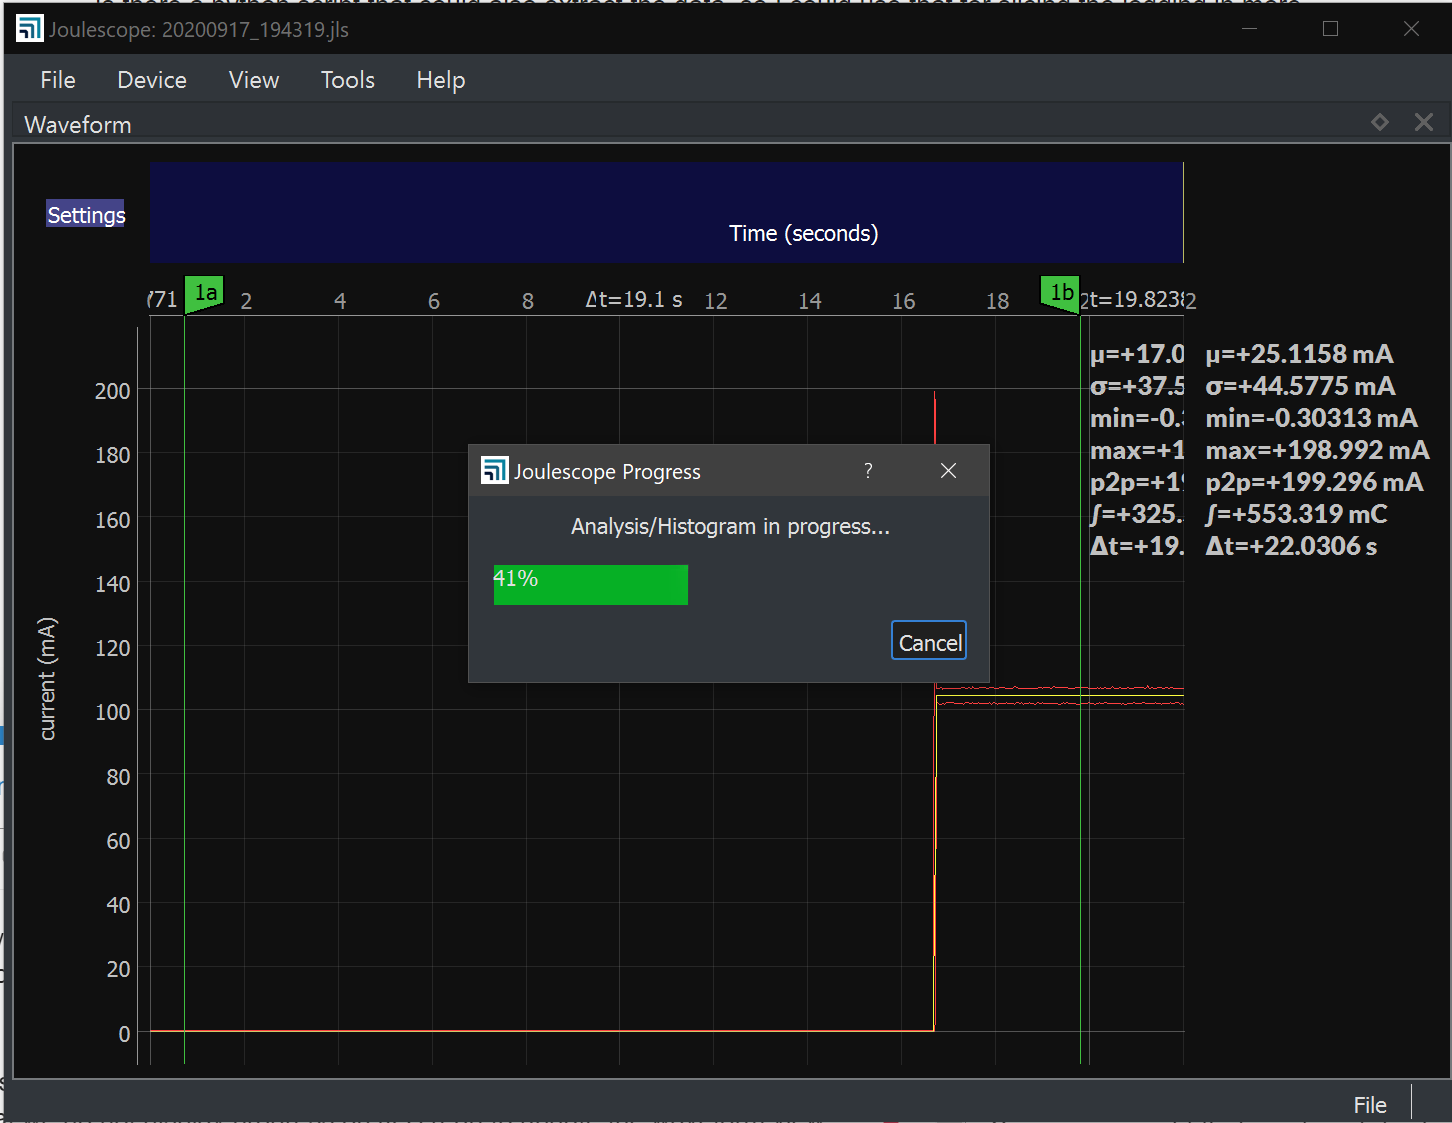
Yes, you are right that we do not display progress on JLS read to update the waveform view. However, you should see it for histograms and all of the Analysis tools, like this:
Do you not see a progress window like this? If you do not, could you post the Joulescope UI version you are using including your platform (Windows, Linux, macOS)?
4. Single Value Display on JLS file load
I just tried this, and I confirm that the Single Value Display is not cleared on JLS file load. I understand how this could be confusing. I created Issue #99.
Good Morning @mliberty (It is really morning in Germany).
Thanks a lot again for the quick answers.
(including a) I will have a look.
I understand that this is a very challenging task. I would be happily surprised if such a feature could be anyhow, even with limitations, (not all the current allready run measurement could be seen on freeze), realized in future.
no I don’t get that window, My UI Version is 0.9.2 and the JouleScope driver is 0.9.1. I am using windows 10 pro: 10.0.19041 Build 19041 on an lenovo Laptop with a WD SSD: WDC PC SN730 SDBQNTY-512G-1001.
Thanks.
One thing I am not sure about. It could be that I did the following:
Load the 32GB measurement with 10kHz sample rate and therefore rough 230000 seconds. Wait unti I had the signals in the scope view. Zoomed to a certain area, about 5min window of the measurement, selected the dual marker, and then choose right click on the dual marker and choose histogram. I did not wait until I had the detailed signals shown in the scope window. I thing it was still loading data in background for the scope. That may influence why the histogram calculation status bar did not show up? .
best regards
ps_Water
Hi @ps_Water and thanks for following up! I did capture the 10 kHz file that is 36 GB and 237642 seconds (2.75 days) long. When I first open it, there is no progress bar. It takes 1:45 minutes to display a reduced-resolution waveform, and 2:30 minutes until the normal resolution waveform.
If I zoom into a 1-second window around 201015 seconds, it takes 41 seconds to display the normal resolution waveform, again with no progress bar. If I add dual markers and then right-click the marker, select Analysis → Histogram, it takes 3 seconds before the “Histogram configuration” window appears. After pressing Ok, the progress dialog box does appear, and the Histogram appears about 3 seconds later.
Now, if I zoom out and then zoom in to another place, drop dual markers, and select Histogram analysis, all before the waveform updates, then the “Histogram configuration” window takes longer to appear, again without a progress bar. If I am impatient, it seems that starting histogram analysis too soon stops the waveform update and then never displays the “Histogram configuration” window. I believe that this successfully duplicates what you reported, and it is repeatable.
For the time being, the workaround is to wait for the waveform to update before running any of the analysis tools. Since the UI does not have a progress bar, you can use “Task Manager” on Windows to see when the CPU utilization for the Joulescope UI drops to 0%.
Based upon the findings, I created the following issues:
Hi @mliberty, I downloaded the new UI 0.9.3 and tried to open the large measurement with the 32GB which was taken in october with the JouleScope UI 0.9.2. After a long while it showes the rough current and voltage curve, but then for at least 30min, nothing more happens. The detailed curve is not showing up.
Is there a way to transform the old stored .jls file to may be a new .jls format of 0.9.3, if there are changes in the format?
Or is there a way to install multiple JouleScope versions on my computer to still be able to evaluate the old file with the “old” version?
While we made no changes to the .jls file format in 0.9.3, we definitely changed how data was being stored for downsampled data. The JLS file contains samples and then lower-resolution versions of the samples with statistics. With heavily downsampled data, like 10 kHz, the lower-resolution data was stored too frequently. It was also not low resolution enough. Both these factors contributed to the poor read performance. With 0.9.3, we maintain the same resolution ratio as with 2 Msps data, even for 10 kHz data.
I wonder if the Joulescope UI is actually done loading the data, but for some reason does not display it. If you look at Window’s Task Manager, does it still show high CPU utilization for the Joulescope UI? If it’s done, you may have an easy way to convert it to the new format. Right-click on the x-axis, select Annotations → Dual Markers. Click on each marker, move one to the start of the capture and one to the end. Then right-click one of the markers and select Export data. Does this work?
If not, let me know. I will figure out a way. Are you able to run Python 3.8 or 3.9 on your machine?
We do not currently support this with the Joulescope UI installer. However, you could install 0.9.2 and then run 0.9.3 from Python directly. You can find the instructions for running from python here.
Hi @mliberty, I just came back from my holidays. I will see if I can try your suggestions soon.
I will let you know the results, as soon as I have them.
best regards
Peer
Hi @mliberty, now I tried all things related to that point.
First the Export of the data with JouleScope_UI 0_9_3 did not work. Even with looking to the Task Manager and waiting after every step that the CPU load is decreased again, the Export Data is not doing anything finally.
more Detailed first way tried:
start JouleScope_UI
load the file 46GB measurement at 10kHz about 315000 seconds → wait 2 min until the CPU load decrease: (the Ram usage drops at the End suddenly about 3GB) the current and Voltage curve in the oscilloscope are still only rough. Longer waiting change nothing.
export all data directly → after 2min the cpu load decrease again → then nothing. No open file choosing/saving window)
more Detailed second way tried:
start JouleScope_UI
load the file 46GB measurement at 10kHz about 315000 seconds → wait 2 min until the CPU load decrease: (the Ram usage drops at the End suddenly about 3GB) the current and Voltage curve in the oscilloscope are still only rough. Longer waiting change nothing.
select dual marker → wait until CPU load decrease after 10 seconds.
move the first marker to the start → wait until CPU load decrease after 10 seconds.
move the second marker to the end → wait until CPU load decrease after 2 minutes.
export data on second marker at the end → wait until CPU load decrease after 1 minutes. → then nothing. No open file choosing/saving window)
To be sure that’s not me, I tried a small old measurement also, there all works fine.
Yes I can run python. 3.9.1 is install currently
Second the way of running two versions of JouleScope_UI, one by install (0.9.2) and one by python (0.9.3) did work, but is very inconvenient. May there is a better solution in future.
In total if there is a python script for converting the measurement from 0.9.2 format to 0.9.3 format (or only the down sample storage inside) that would also be good.
If I understand correctly, you want to open a10 kHz downsampled JLS file recorded with 0.9.2 or earlier. The changes in 0.9.3 fixed the 10 kHz downsampled JLS recording, but 0.9.3 did nothing to improve the loading of files recorded with 0.9.2 or earlier.
I created a new script that reads a JLS file and writes it to a new JLS file in the latest format. See jls_recode.py. You run it like this:
python jls_recode.py [infile.jls] [outfile.jls]
You will need to install pyjoulescope. For directions, see the docs.
I did some basic testing on jls_recode.py, and it seems to work fine. I did not perform exhaustive testing. Unfortunately, I could not find my very long 0.9.2 10 kHz recording to really try it out.
HI @mliberty,
I am not sure about the term “downsampled” but more or less that is what i intended to do.
When installing JS_UI 0.9.3 the first time, I soon noticed that large measurements taken with it are opened much faster again, as that was the case in 0.9.2. Also the zooming and so on is much faster. But when I tried open old measurement files taken with 0.9.2 in 0.9.3 it was even worse then handel them with 0.9.2 itself.
Back to the term “downsample”: I just set the sample rate in the setting to 10kHz, so for me that is the initial sample. I am still struggling with the “down” of “downsample”. Is the Joulescope still using the higher sample rate and only the data stored and shown is using the setting rate? (Never the less this is of topic.)
Back to the topic. The Phyton script works very well also with the big files. It take some time to recode them but then the handling in 0.9.3 is great. Also my biggest fill of aprox. 48GB reduced by 2GB.
So therefore this is perfect.
Thank you very much.
Great to hear things are working! I will mark my previous reply as the solution, but please post below with more questions or issues.
Downsampling
Your Joulescope JS110 always samples at 2,000,000 times per second (2 Msps). The JS110 forwards the raw sample data to the host computer. The host computer then applies the calibration and performs some processing to produce the real data in SI units. When you change the sampling_frequency you are actually inserting an additional processing step on the host computer that performs downsampling. The software applies a digital filter to prevent aliasing, then discards samples to reduce the frequency.
An interesting side-effect is the JLS file. In full 2 Msps mode, the JLS file stores the raw samples. When you load the file, the software converts these raw samples into SI units, just like when they come from the physical instrument.
We can no longer do this in the downsampled mode as things like the current range have already been applied. Instead, they are stored as float32 values. So, the data format stored in the JLS file changes when you select downsampling.
 : If a logging file is loaded it would make sense to reset or show indication messages within the “single value” windows of the UI, they keep the last value from a valid measurement if the device is also connected on the PC, and at the beginning this is always misleading. (Even with knowing it after sometime, I still get misleaded in the beginning.)