It sounds like you already know how to make automated captures. If I understand correctly, you are now trying to open a JLS and plot it to a PNG file. The Joulescope UI does not support this as an automated method, only by using the Joulescope UI application.
You can find the Joulescope UI waveform plotting code in joulescope_ui.widgets.waveform, starting with waveform.py. You could modify this code to use it directly, but that is not something we currently support.
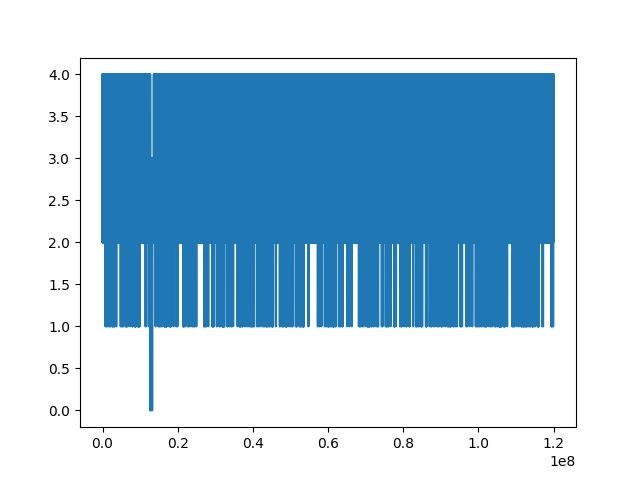
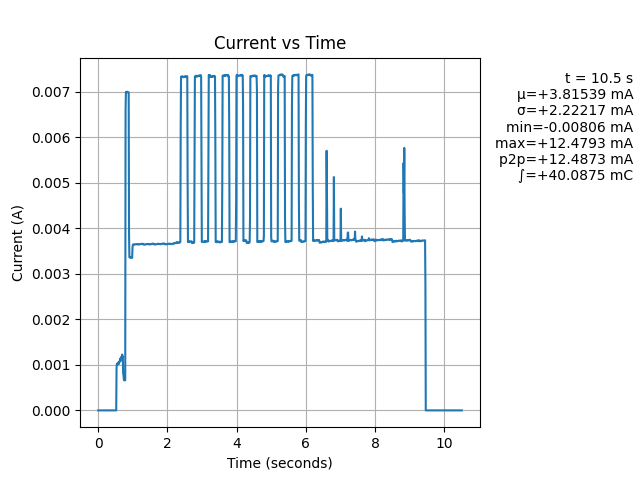
Note that the current_range_extract script plots the current range selection, not actually the current. I am assuming that you want to plot the current.
One key difference between your Matplotlib plot and the Joulescope UI plot is the concept of “reductions”. Instead of plotting every point, the Joulescope UI plots the mean of all samples represented by a pixel. It also can plot min & max, but I see you have that turned off. Instead of using DataReader.samples_get, you can call DataReader.data_get. For example, if you want to plot 1000 points, you can do something like:
from joulescope.data_recorder import DataReader
r = DataReader().open(filename)
start_idx, stop_idx = r.sample_id_range
incr = (stop_idx - start_idx) // 1000
data = r.data_get(start_idx, stop_idx, incr, units='samples')
i = data[:,0]
Now, you ideally want to specify incr so that it exactly matches the number of x-axis pixels in your PNG plot. However, Matplotlib will do mostly the right thing if you provide too many or too few pixels.
Qt is very picky about Widget layout. With the approach above, the wv widget is not part of the layout, so it will not behave correctly. Also, the code is going to load the last UI settings, which means anytime you use the actual Joulescope UI it may affect this script. It also never executes the Qt event loop, so Qt will never render.
I see three possible approaches:
Attempt to use most of the full Joulescope UI code but load “fixed” defaults.
Create a stripped-down Qt application with just the WaveformWidget.
Use Matplotlib
(1) and (2) are going to be challenging. I took a quick look, and I don’t see any quick path to get this done. Unfortunately, we don’t have the resources to develop either (1) or (2) in the near future.
(3) is relatively easy. Here is some code that may be good enough:
#!/usr/bin/env python3
# -*- coding: utf-8 -*-
import argparse
import numpy as np
import sys
import matplotlib.pyplot as plt
from joulescope.data_recorder import DataReader
from joulescope.view import data_array_to_update
def get_parser():
p = argparse.ArgumentParser(
description='Convert a JLS file to an image plot.')
p.add_argument('input',
help='The input filename path.')
p.add_argument('output',
help='The output filename path.')
p.add_argument('--sample_count',
type=int,
default=1000,
help='The number of samples to display')
return p
def run():
args = get_parser().parse_args()
r = DataReader().open(args.input)
start_idx, stop_idx = r.sample_id_range
d_idx = stop_idx - start_idx
print(f'{start_idx}:{stop_idx} ~ {d_idx}')
f = r.sampling_frequency
incr = d_idx // args.sample_count
data = r.data_get(start_idx, stop_idx, incr, units='samples')
x = np.linspace(0.0, d_idx / f, len(data), dtype=np.float64)
x_limits = [x[0], x[-1]]
s = data_array_to_update(x_limits, x, data)
f = plt.figure()
ax_i = f.add_subplot(1, 1, 1)
ax_i.grid(True)
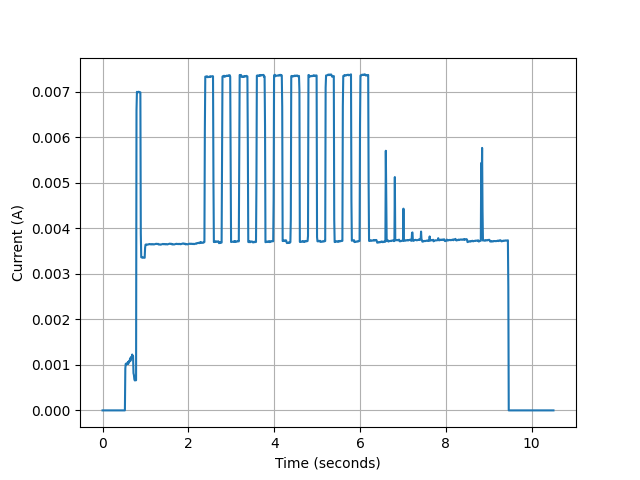
ax_i.plot(x, s['signals']['current']['µ']['value'])
ax_i.set_xlabel('Time (seconds)')
ax_i.set_ylabel('Current (A)')
# plt.show()
f.savefig(args.output)
if __name__ == '__main__':
sys.exit(run())
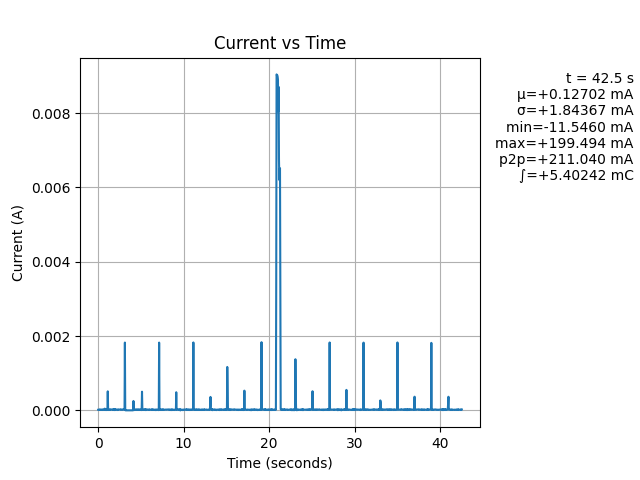
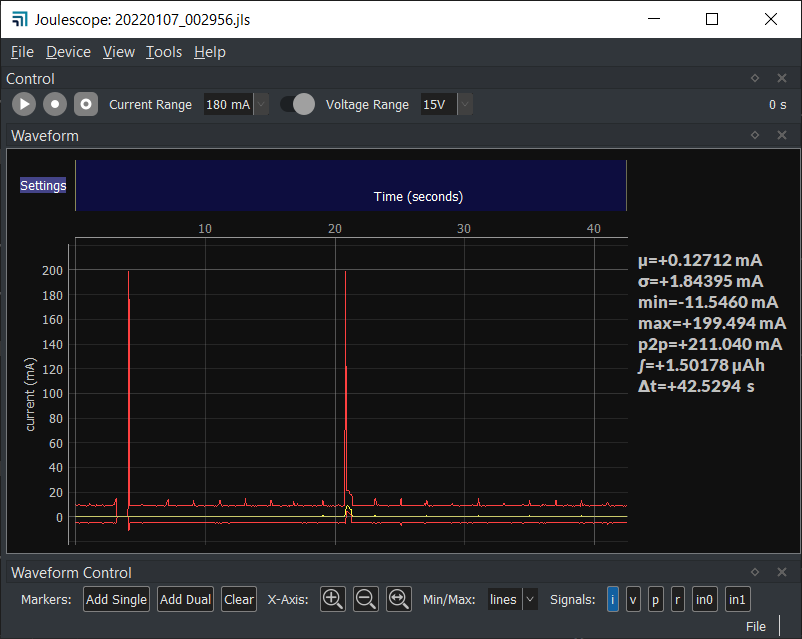
I took a look at a few JLS files, and they look right without any mirroring. Could you please open that same JLS file in the Joulescope UI to confirm that it is mirrored?
I think that they are the same. Note that the jls_plot code is not plotting min/max. I followed what you had in your initial plot with min/max turned off. In the Joulescope UI, turn off min/max and see if they look the same. Note that adding min/max to the jls_plot script is easy.
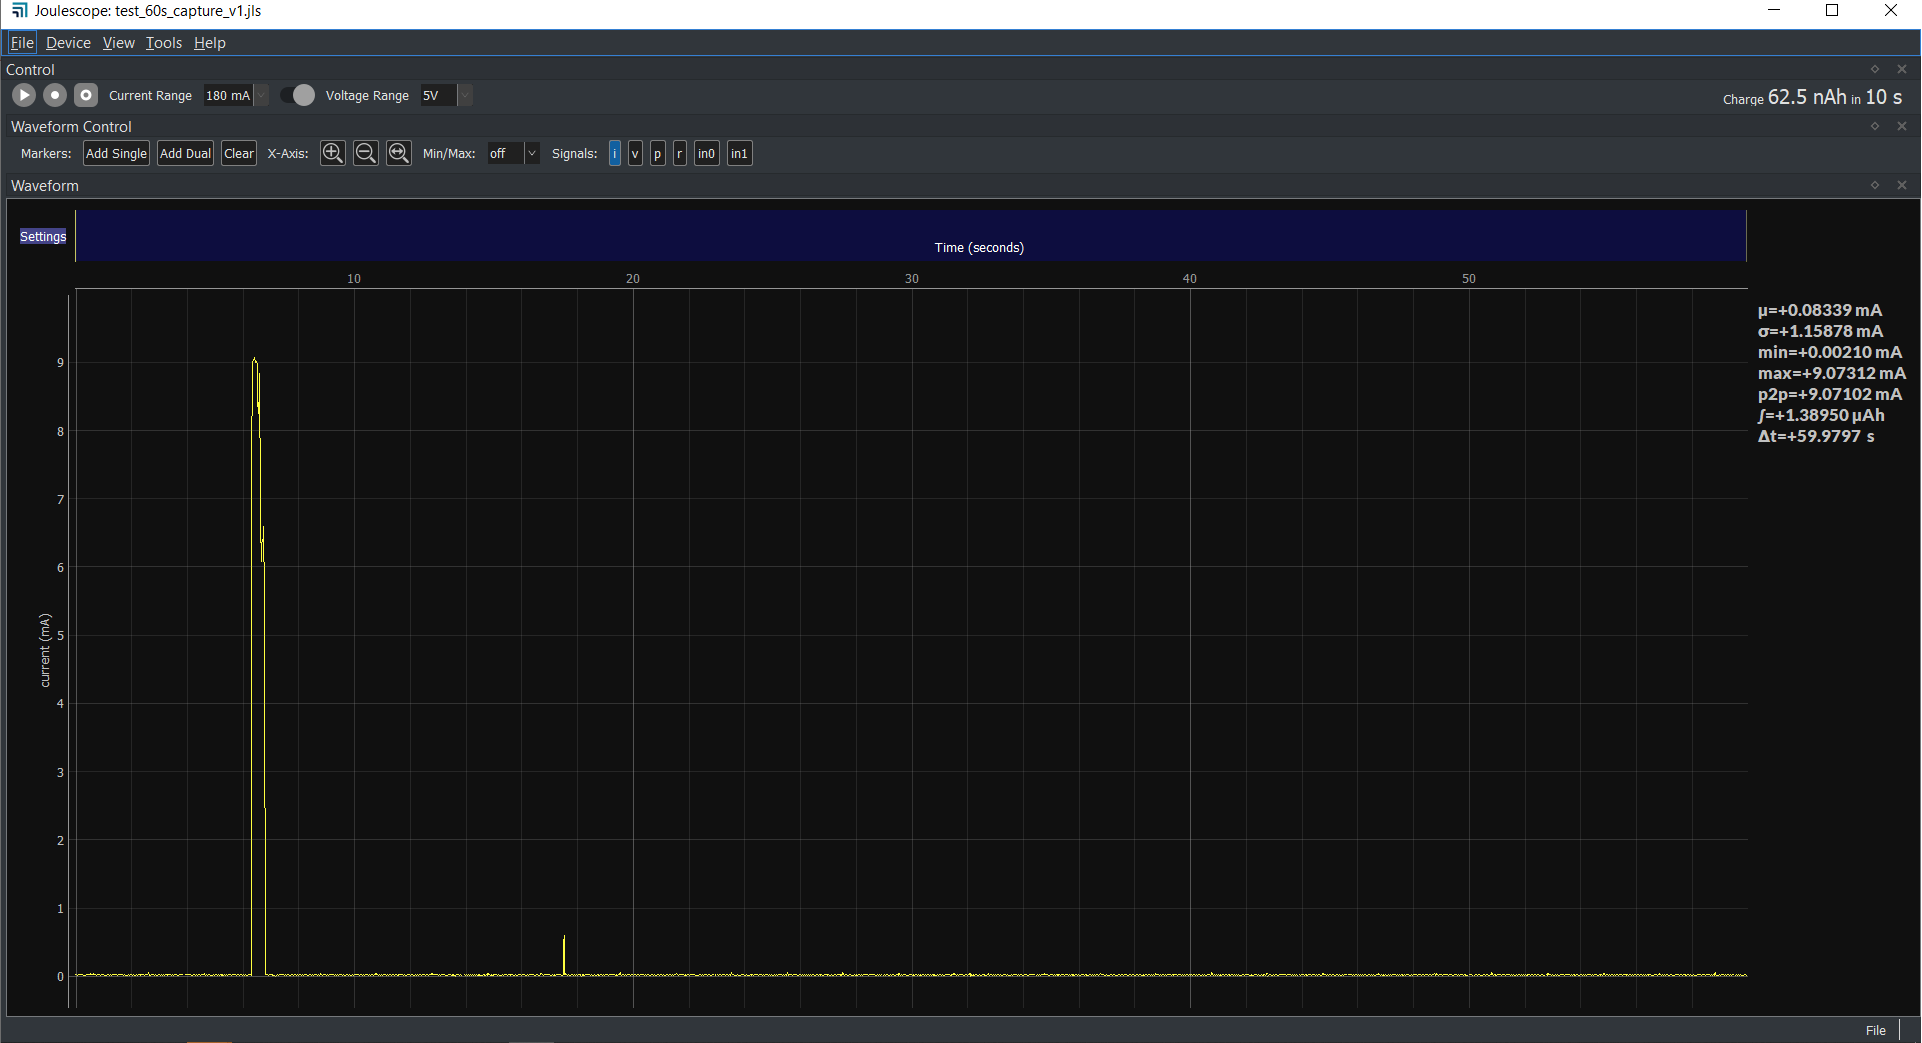
Hi @lukGWF - The ∫ (integral) shown in the image above displays the integral of current over the window, which is the charge. The units are in coulombs (C), which is equivalent to ampere seconds. If you want ampere hours (Ah), divide by 3600.
Hi
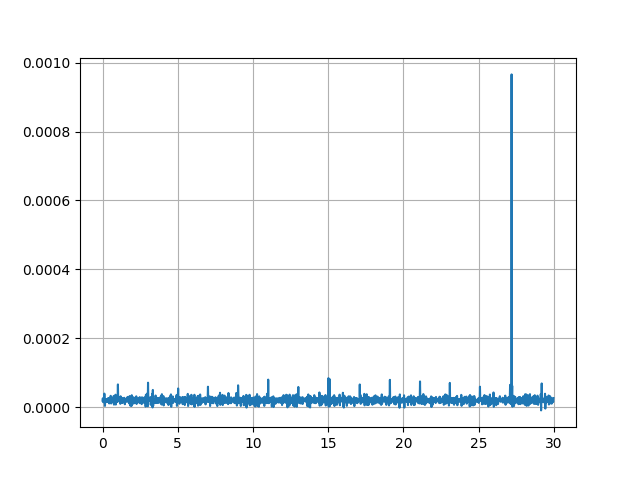
I have continued and am finding peaks in long-time records. I have optimized the samplerate (recording) and --sample_count to a speedup the process of analysation. Using 200k samplerate and sample_count of: 500 the elapsed time is 10s, at 50:93s, at 5:286s.
When I look at htop the process only used one single cpu. Do you think it is possible to make use of multiprocessing? The time consuming loop is the data_recorder.py (v0.9.7) line 1061… “_statistics_get_handler_float32_v2”.
The RAM consumption is 2GB.
One CPU-core is at 100%.
What do you expect could be improved in time using change the package to cupy for these basic operations?
If I understand correctly, you are profiling the performance of jls_plot.py. The JLS v1 file format that you are using offers decent performance on huge files, but our newer JLS v2 file format is much, much faster. You can find details on JLS v2 on GitHub. The Joulescope UI can already display JLS v2, but it still records to v1.
If you want, you can provide --jls 2 to capture.py, and it will record a JLS v2 file.
The next challenge is reading the JLS v2 file, as we do not have many examples yet. However, I just updated the jls_plot.py example to also handle JLS v2 files.
Hi @mliberty
Until now I was recording up to ~20GB in one file and the script was working.
Now I did 3600s which allocated 28GB and then the output of the scripts was
2022-02-10 16:46:25,157 - main - INFO - Reading JLS v1: C:\code\pyjoulescope_examples_\20220209_standby_jls2.jls
Traceback (most recent call last):
File “C:\code\pyjoulescope_examples_\bin\jls_plot.py”, line 810, in
sys.exit(run())
File “C:\code\pyjoulescope_examples_\bin\jls_plot.py”, line 384, in run
data = r.data_get(start_idx, stop_idx, incr, units=‘samples’)
File “C:\tools\miniconda3\envs\pyjsui\lib\site-packages\joulescope\data_recorder.py”, line 1047, in data_get
out = stats_array_factory(out_len)
File “joulescope\stream_buffer.pyx”, line 206, in joulescope.stream_buffer.stats_array_factory
numpy.core._exceptions.MemoryError: Unable to allocate 322. GiB for an array with shape (1440003902, 6) and data type [(‘length’, ‘<u8’), (‘mean’, ‘<f8’), (‘variance’, ‘<f8’), (‘min’, ‘<f8’), (‘max’, ‘<f8’)]`
Can you tell me what arguments you are providing to jls_plot? I suspect that sample_count is way too big. You ideally want sample_count to be the width of the plot axes in pixels.
Thanks for this hint. I need to give more information to you that you can understand the task. I extended the software to be able to recognize current-patterns as they are defined using different parameters length, charge, heights … I got that working but need the 2MSps resolution. So I also need to be able to load files with that size. What is the max length I can read so I can iterate over the file by loading parts in the lines
r = Reader(args.input)
signals = [s for s in r.signals.values() if s.name == ‘current’]
Hi @lukGWF - I am not sure I am totally following what you are trying to do. We started this thread with plotting long-term records, and it sounds like you are happy with that.
If I understand correctly, you are now trying to analyze each sample within a JLS file. As you already noted, you often cannot load an entire JLS file into memory. You instead need to process blocks. The size of blocks is limited by your computer’s RAM, not by anything in the pyjoulescope code.
You want the chunks small enough to easily fit in RAM but large enough to keep processing overhead low. At full rate, 1 second (2,000,000 samples) is a reasonable amount.