Hello,
Looking for guidance on how to export to csv… I have tried py recording but that is only for v1?? I tried right-click export and changing filename to .csv but this provides no useable data. Any assistance would be appreciated.
Thank you,
Hi @cherkey and welcome to the Joulescpoe forum! The Joulescope UI currently does not have a way to export full-rate sample data to CSV. We used to have this feature, but it was a support problem. Too many peaple saved long full-rate data captures to CSV and attempted to open with Excel. Unfortunately, Excel only supports 1,048,576 rows, or about 1 second of full rate JS220 data (0.5 seconds of JS110 data).
The proprietary but open-source JLS binary file format is specially designed to handle Joulescope data rates for long captures while allowing for super-fast read navigation including pan and zoom. The JLS file format is definitely not compatible with CSV text format.
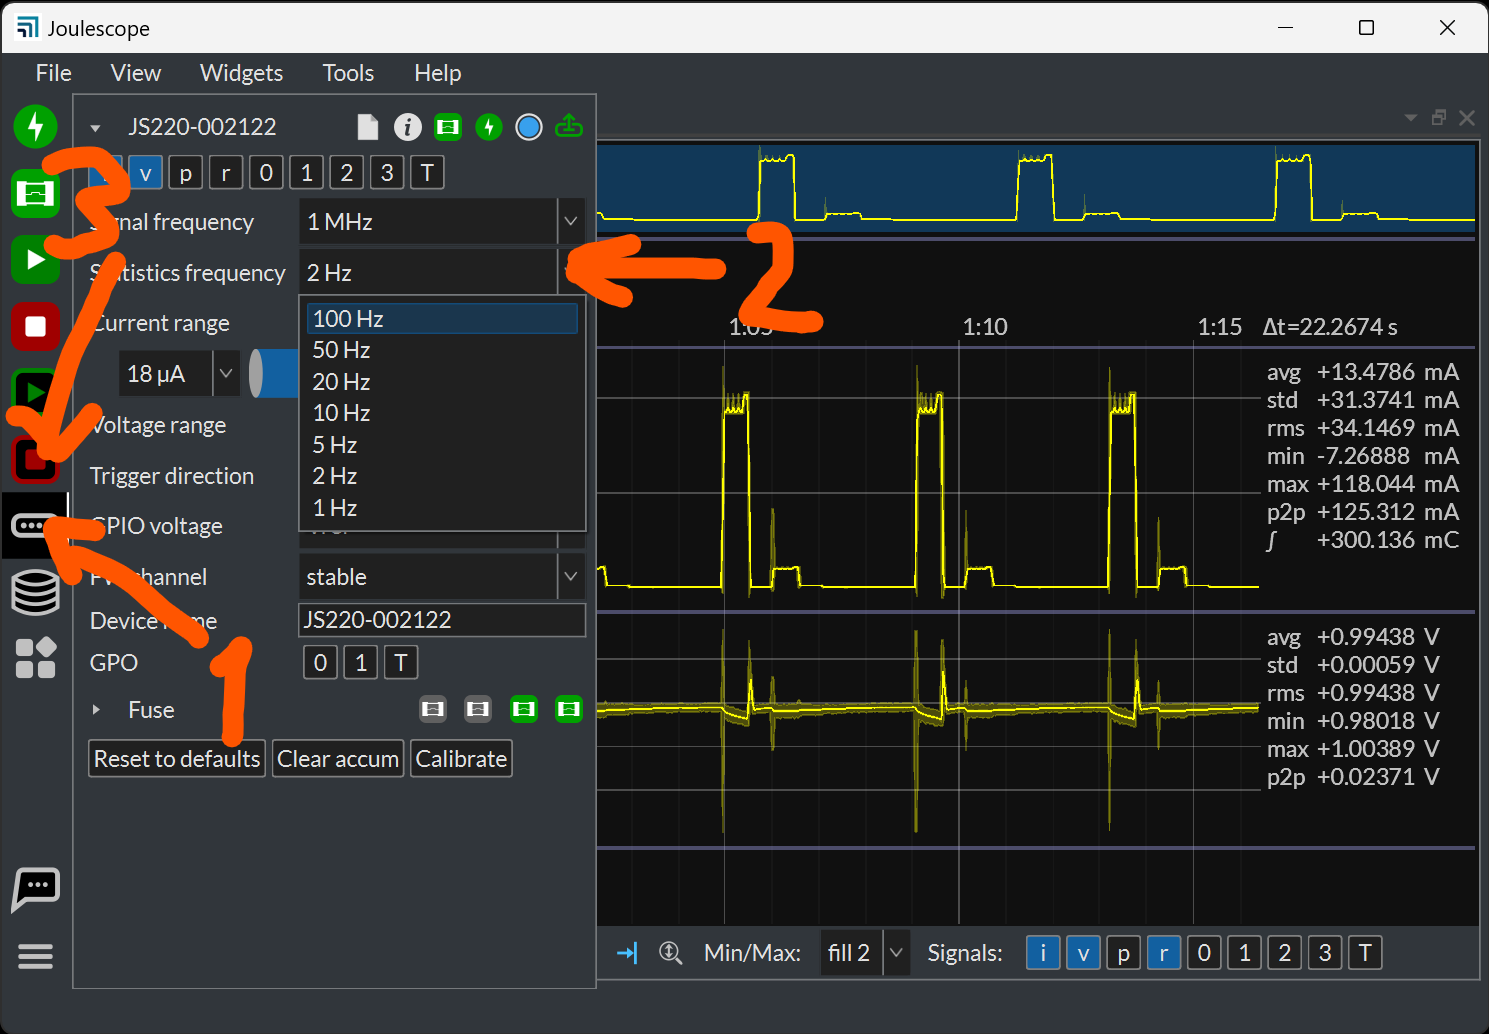
You can record statistics data (defaults to 2 Hz, but the UI allows you to select up to 100 Hz) to CSV. Here is how:
Is statistics data fast enough for your application? If so, great!
If not, I have a few questions:
- How long of snippets are you looking to export?
- At what sampling frequency?
- What are you looking to do with this data?
- Why CSV file format?
Note: we also received issue report 20240206_154725_7852075.
Hi, @mliberty ,
I will look at the statistics method - I was recording at 100Hz anyway so this should be sufficient.
I’m doing several runs of various scenarios and I’m going to incorporate the data into one chart for visual comparison.
I’ll reply back with how it went with statistics.
Thank you
How are you generating the chart? Do you plan on using Excel?
If you are using python to generate the chart, you can load the JLS files directly using our pyjls package. See the pyjls.Reader.fsr method.
100 Hz is reasonable to what to export to CSV. You will be limited to:
1024 * 1024 / (100 * 60 * 60) => 2.9 hours
You can convert signales from your existing jls files to csv, too. After installing Python and pyjls, type:
python -m pyjls export --help
For example:
python -m pyjls export --signal current infile.jls outfile.csv
Hi @mliberty ,
The statistics output will provide what is needed.
Thank you,
1 Like
Hi,
I tried to export csv file like this
"
python -m pyjls export --signal current C:\Users\choujason\AppData\Local\Programs\Python\Python312\20240318_072015.jls outfile.csv
"
but no csv file was generated in the folder with terminal window responsed “nan count = 0” . Did I do anything wrong?
Hi @Jason and welcome to the Joulescope forum!
The script deals with full paths. In this case, the outfile.csv would have been created in the current path. If you want to generate this in the same path as the jls, the easiest way is to change directory, like this:
cd C:\Users\choujason\AppData\Local\Programs\Python\Python312
python -m pyjls export --signal current 20240318_072015.jls outfile.csv
Does this work for you?
We have found that most people exporting to CSV want to use Excel to analyze data. Excel supports a maximum of 1048576 rows, which is about 0.5 seconds of JS110 full-rate data and 1 second of JS220 full-rate data. Exporting seconds or minutes of data to CSV and expecting them to load in Excel was on of our top support issues in the old UI. We removed this feature in 1.x.
For customized data analysis, we highly recommend using Python. Compared to Excel, Python analysis is:
- Easily repeatable
- Observable - no “hidden” code in cell forumulas
- Version control friendly
- Testable
- Can easily generate plots with Matplotlib.
- Can also generate Excel reports. See openpyxl.
- Can easily load JLS files using the
pyjlspackage.
However, we have a new script that allows you to extract points into a CSV file. The advantage is that this method supports multiple simultaneous Joulescopes and multi-rate data while allowing you to limit the number of total points. See jls_export_points.py.
Is there anyway to make pyjls export the time stamp?
It only seems to export signals for me. I tried:
pyjls export infile.jls outfile.csv
My JLS file only contains current.
I can add a time column with jls_export_points.py. The thing I don’t like about this script is that I have to specify the number of points. I my case I want all points converted like pyjls. I have to start guessing how many samples are in the file. I end up getting current: less than one sample per point.
Hi @Jeremiah - I took a look, and as it exists today, the export entry point only supports samples, no additional timestamp.
If you want actual samples, then jls_export_points.py is not the right script. The purpose of jls_export_points.py is to convert long JLS captures at full sample rate into CSV files that you can actually load into Excel.
The samples are at a fixed period, so you know the relative time to the JS220’s oscillator accuracy of ± 25 ppm.
What additional time information do you want? Some options include:
- absolute UTC time
- UTC aligned with period adjustment
- An equation to generate the relative time offset
Thanks for looking at this. In this instance, #3, where the first sample is t=0. I needed a CSV file to import into a SPICE model. I ended up creating a timestamp column incrementing each sample by the sampling frequency.
Hi @Jeremiah - Great that you found a solution! If you need to do this repeatedly, it would be easy to create a custom script or add a --timestamp option to the pyjls export entry point.
I would recommend adding --timestamp to the export function as a low priority item. I am sure it would be useful to others.
1 Like
pyjls 0.10.0 adds the --timestamp argument to the export entry point. You can use this to add a timestamp column to an exported CSV file.
To update:
python -m pip install -U pyjls
Hi
Hoping that this thread still is alive.
I have a very long .jls file of 1.2 GB (1kHz for 24 hours) which is great for looking at details in the measurements.
But I want to plot the measurement in excel together with some temperature data. So, I need to export the .jls file to a much smaller .csv file. jls_export_points seems like a perfect solution, but I can’t get it to work.
I write this in the terminal:
python -m pyjls export --length 1441 --timestamp 20250331_055951.jls output.csv
When running this line I get this failure:
ERROR:2025-03-31 11:19:57,638:raw.c:106:pyjls.c:file header crc mismatch: 0x2f0eb323 != 0x1e747614
Traceback (most recent call last):
  File "<frozen runpy>", line 198, in _run_module_as_main
  File "<frozen runpy>", line 88, in _run_code
  File "C:\Users\sba\AppData\Local\Programs\Python\Python312\Lib\site-packages\pyjls\__main__.py", line 82, in <module>
    sys.exit(run())
             ^^^^^
  File "C:\Users\sba\AppData\Local\Programs\Python\Python312\Lib\site-packages\pyjls\__main__.py", line 78, in run
    return args.func(args)
           ^^^^^^^^^^^^^^^
  File "C:\Users\sba\AppData\Local\Programs\Python\Python312\Lib\site-packages\pyjls\entry_points\export.py", line 56, in on_cmd
    with Reader(args.infile) as r:
         ^^^^^^^^^^^^^^^^^^^
  File "pyjls/binding.pyx", line 557, in pyjls.binding.Reader.__init__
  File "pyjls/binding.pyx", line 270, in pyjls.binding._handle_rc
RuntimeError: open UNSUPPORTED_FILE[26]: The target file is not supported.
Hope you can help ![]()
Hi @Sigurd,
That error
ERROR:2025-03-31 11:19:57,638:raw.c:106:pyjls.c:file header crc mismatch: 0x2f0eb323 != 0x1e747614
indicates that 20250331_055951.jls is not a valid JLS file.
I have a few questions:
- Is this a valid JLS file that you recently recorded with the Joulescope UI?
- Are you able to open this JLS file in the Joulescope UI?
Once you have a valid JLS file, then jls_export_points.py should work for you.
Hi @mliberty
Yes and yes. I exported the JLS file yesterday with the UI and I am able to to open again with the UI.
I just realized that I was using an older version of the UI. I have updated and now it works.
I write this in the command line:
python -m pyjls export --signal voltage --length 1441 --timestamp New_SW_infile.jls outfile.csv
My understanding was the many samples of the JLS file would be averaged into csv file containing the whole measurement, but of course in a lower resolution. But instead I just get the first 1441 samples of the measurement and not the whole signal.
Hi @Sigurd - We have two different JLS files formats. JLS v1 was recorded by the Joulescope UI before 1.0. JLS v2 reader support was added to Joulescope UI 0.9.4. Joulescope UI 1.0 and later all record to JLS v2. The pyjls package only supports JLS v2.
The pyjls export command exports exact samples only. You can use --start and --length options to extract a subset of samples. Here is the full help:
> python -m pyjls export --help
usage: __main__.py export [-h] [--signal SIGNAL] [--start START] [--length LENGTH] [--timestamp] infile outfile

positional arguments:
  infile                JLS input filename
  outfile               The output filename. Supported extensions are bin, csv

options:
  -h, --help            show this help message and exit
  --signal SIGNAL, --signal_id SIGNAL
                        The signal name or id to export.
  --start START         The starting timestamp (inclusive).
  --length LENGTH       The number of samples to export.
  --timestamp           Include a timestamp column (valid for csv, ignored otherwise).
You likely want to use jls_export_points.py. Here is the help:
> python jls_export_points.py --help
usage: jls_export_points.py [-h] [--verbose] [--columns COLUMNS] [--offset OFFSET] [--duration DURATION]
                            [--ratio RATIO] [--no-header] [--count COUNT]
                            input output

Read a JLS file, compute points, and export a CSV file.

positional arguments:
  input                The input filename path.
  output               The output filename path.

options:
  -h, --help           show this help message and exit
  --verbose, -v        Display verbose information.
  --columns COLUMNS    The JLS signals to export to CSV. Defaults to "voltage,current". Signals may be specified in
                       any of the following formats: signal_name, signal_id, source_id.signal_name,
                       source_name.signal_name
  --offset OFFSET      The starting offset in ISO 8601 format such as YYYYMMDDThhssmm.ffffffZ
  --duration DURATION  The capture duration, which defaults to units of float seconds. Add a suffix for other units:
                       s=seconds, m=minutes, h=hours, d=days. If not specified, use the entire file.
  --ratio RATIO        The ratio of used samples for each point from 0.0 to 1.0. 1.0 uses all samples in the point
                       range. 0.0 uses one sample.
  --no-header          Omit the CSV header when specified.
  --count COUNT        The number of points to compute over the duration
To export 1441 points of voltage, you can use it like this:
python jls_export_points.py --columns voltage --count 1441 New_SW_infile.jls outfile.csv
That works! Did not realize it was two different scripts.
Thank you for your support
1 Like