Hi @hthalljr! Here is a script that can read a JLS file and extract points to a CSV file:
#!/usr/bin/env python3
# Copyright 2024 Jetperch LLC
#
# Licensed under the Apache License, Version 2.0 (the "License");
# you may not use this file except in compliance with the License.
# You may obtain a copy of the License at
#
#     http://www.apache.org/licenses/LICENSE-2.0
#
# Unless required by applicable law or agreed to in writing, software
# distributed under the License is distributed on an "AS IS" BASIS,
# WITHOUT WARRANTIES OR CONDITIONS OF ANY KIND, either express or implied.
# See the License for the specific language governing permissions and
# limitations under the License.

"""Read a JLS file, compute points, and export a CSV file."""

from pyjls import Reader
from pyjoulescope_driver import time64
import argparse
from datetime import datetime
import numpy as np
import sys


def _ratio_validate(s):
    f = float(s)
    if f < 0 or f > 1.0:
        raise ValueError(f'Invalid ratio {s}')
    return f


def parser_config(p):
    """Read a JLS file, compute points, and export a CSV file."""
    p.add_argument('--verbose', '-v',
                   action='store_true',
                   help='Display verbose information.')
    p.add_argument('--columns',
                   default='voltage,current',
                   help="""The JLS signals to export to CSV.  Defaults to "voltage,current".
                   Signals may be specified in any of the following formats:
                   signal_name, signal_id, source_id.signal_name, source_name.signal_name""")
    p.add_argument('--offset',
                   help='The starting offset in ISO 8601 format such as YYYYMMDDThhssmm.ffffffZ')
    p.add_argument('--duration',
                   type=time64.duration_to_seconds,
                   help='The capture duration, which defaults to units of float seconds. '
                        + 'Add a suffix for other units: s=seconds, m=minutes, h=hours, d=days. '
                        + 'If not specified, use the entire file.')
    p.add_argument('--ratio',
                   type=_ratio_validate,
                   default=1.0,
                   help='The ratio of used samples for each point from 0.0 to 1.0. '
                        + '1.0 uses all samples in the point range. '
                        + '0.0 uses one sample.')
    p.add_argument('--no-header',
                   action='store_true',
                   help='Omit the CSV header when specified.')
    p.add_argument('--count',
                   type=int,
                   default=100,
                   help='The number of points to compute over the duration')
    p.add_argument('input',
                   help='The input filename path.')
    p.add_argument('output',
                   help='The output filename path.')
    return p


def on_error(msg):
    sys.stderr.write(f'ERROR: {msg}\n')
    sys.stderr.flush()
    return 1


def on_cmd(args):
    r = Reader(args.input)

    # determine CSV columns
    sources = dict([(source.source_id, source.name) for source in r.sources.values()])
    signals = {}
    columns = []
    for signal in r.signals.values():
        source_name = sources[signal.source_id]
        signals[(str(signal.source_id), signal.name)] = signal
        signals[(source_name, signal.name)] = signal
        signals[(str(signal.signal_id), )] = signal
        signals[(signal.name, )] = signal
    for column in args.columns.split(','):
        parts = column.split('.')
        signal = signals[tuple(parts)]
        if len(sources) > 2:
            column_name = f'{sources[signal.source_id]}.{signal.name}'
        else:
            column_name = signal.name
        column_element = {
            'name': column_name,
            'signal': signal,
            't_start': r.sample_id_to_timestamp(signal.signal_id, 0),
            't_end': r.sample_id_to_timestamp(signal.signal_id, signal.length - 1),
        }
        columns.append(column_element)

    if args.verbose:
        print('Columns to export:')
        for column in columns:
            t_start = time64.as_datetime(column['t_start']).isoformat()
            t_end = time64.as_datetime(column['t_end']).isoformat()
            print(f'  {column["name"]}: {t_start} to {t_end}')

    # Determine offset and duration
    # Use timestamp to align the points across signals since
    # JLS signals are independent, may be at different sample rates,
    # and are not guaranteed to be sample aligned.
    t64_start = max([e['t_start'] for e in columns])
    t64_end = min([e['t_end'] for e in columns])
    if args.offset:
        t64_offset = time64.as_time64(datetime.fromisoformat(args.offset))
        if t64_start <= t64_offset < t64_end:
            t64_start = t64_offset
        else:
            t1 = time64.as_datetime(t64_offset).isoformat()
            t2 = time64.as_datetime(t64_start).isoformat()
            t3 = time64.as_datetime(t64_end).isoformat()
            return on_error(f'offset {t1} out of range: [{t2}, {t3}]')
    t64_duration = t64_end - t64_start
    if args.duration is not None:
        args_duration = int(time64.SECOND * args.duration)
        if args_duration > t64_duration:
            t1 = time64.duration_to_seconds(args_duration)
            t2 = time64.duration_to_seconds(t64_duration)
            return on_error(f'Duration exceeded: {t1} > {t2}\n')
        t64_duration = args_duration

    if args.verbose:
        t_start = time64.as_datetime(t64_start).isoformat()
        t_end = time64.as_datetime(t64_start + t64_duration).isoformat()
        print(f'Export {args.count} points over {t_start} to {t_end}')

    # compute each point
    data = np.empty((args.count, len(columns)))
    ratio = args.ratio
    for col_idx, column in enumerate(columns):
        signal = column['signal']
        signal_id = signal.signal_id
        s_start = r.timestamp_to_sample_id(signal_id, t64_start)
        s_end = r.timestamp_to_sample_id(signal_id, t64_start + t64_duration)
        if (s_end - s_start) < args.count:
            print(f'{column["name"]}: less than one sample per point')
        sample_ids = np.floor(np.linspace(s_start, s_end, args.count + 1))  # need end since using as range
        for row_idx, s in enumerate(sample_ids[1:]):
            s_count = max(1, int((s - s_start) * ratio))  # force at least one sample
            data[row_idx, col_idx] = r.fsr_statistics(signal_id, s_start, s_count, 1)[0][0]
            s_start = int(s)

    # Save to CSV file
    if args.no_header:
        np.savetxt(args.output, data)
    else:
        header = ','.join([column['name'] for column in columns])
        np.savetxt(args.output, data, header=header)
    return 0


def run():
    parser = argparse.ArgumentParser(parser_config.__doc__)
    parser = parser_config(parser)
    args = parser.parse_args()
    return on_cmd(args)


if __name__ == '__main__':
    sys.exit(run())
I also added this to pyjoulescope_examples.
To use this script, you need to install python. Assuming python is then on your path, you can install the dependencies using:
python -m pip install pyjls pyjoulescope_driver
If you save the script as jls_export_points.py, you can then run the script like this:
python jls_export_points.py {in.jls} {out.csv}
Replace {in.jls} and {out.csv} with the full paths to your input and output files. For help on all the arguments, type:
python jls_export_points.py --help
Does this work for you?
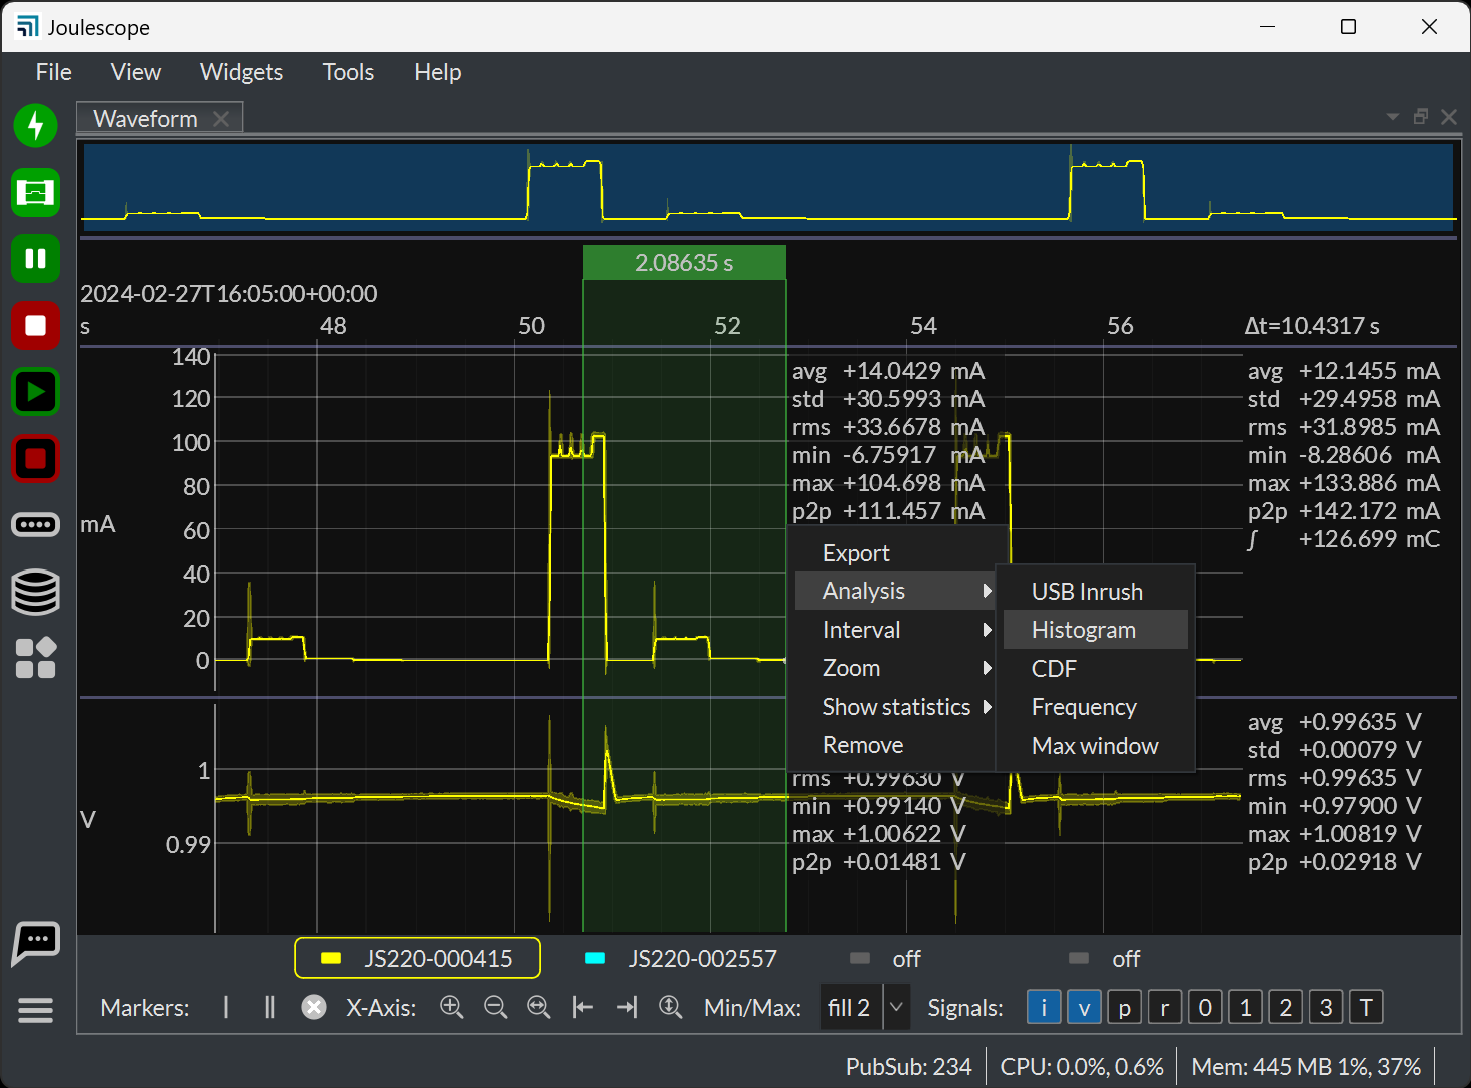
We could also add a current-voltage analysis range tool. It would show up as another range tool when you right-click on a dual marker and seelct Analysis, like this:
Do you do any math before plotting current vs voltage? If you perform math to manipulate the current & voltage, is this something that you are able to share publically?