Comparing measurement, current range and meanig min/ max/ av

Hello! This topic is about some questions I have after using the Joulescope for a while.

  • First of all i’m wondering if changing the current range only changes the scoop view, or does it also affects some settings inside the Joulescoop (like changing the resistance for example).
  • Also, what does minimum/ maximum/ average really stand for? I assume the min and max values are the measurement error. So that average is the average between those two.
  • Is there any method to compare the different measurements automatically? If not, are there any convenient methods to do this manually?
1 Like

Hi @Groj and welcome to the forum! I hope that you have been finding your Joulescope useful, and I will answer each of your questions below.


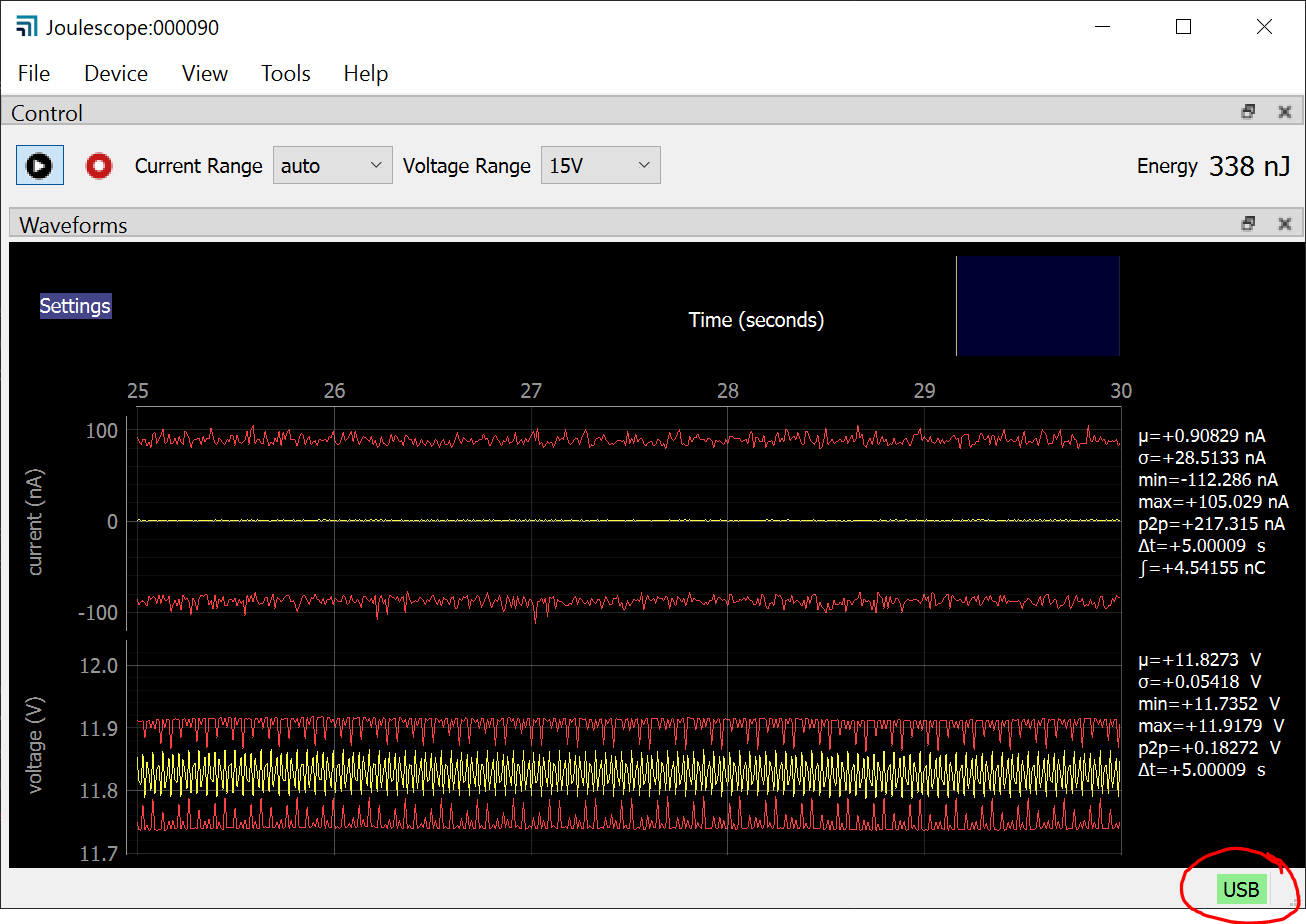
Yes, when you manually select a range (or while autoranging), your Joulescope is selecting a very specific resistor value. I presume that you are talking about the Current Range drop-down in the Control panel:


Joulescope is a shunt ammeter, which means that it measures current by measuring the voltage over a resistor. In autoranging, Joulescope actively selects the best resistor to keep the total voltage drop across the resistor to 20 mV or less. Here is a table from the Joulescope User’s Guide that tells you the Impedance (resistance) that Joulescope uses for each range:

If you right-click on the y-axis, you will notice that it displays the Range option:
image

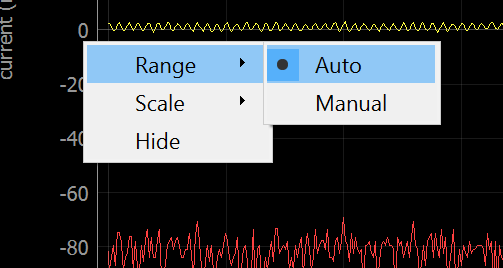
This y-axis Range option only affects the UI display of the captured data and does not in any way affect the current range selection (or the Joulescope shunt resistor selection).


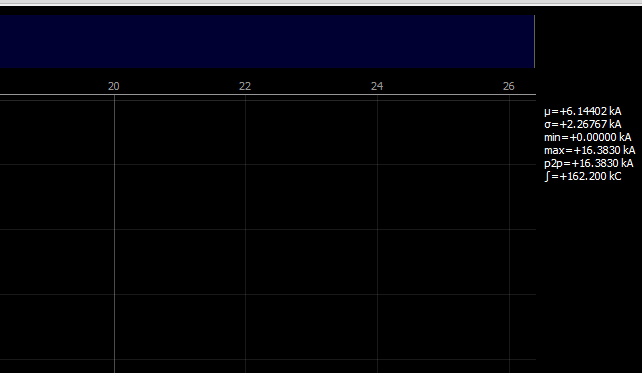
Joulescope samples current and voltage 2 million times per second. Unless you zoom very far in along the time x-axis, each x-axis pixel represents a time window that may contain many, many individual samples. By default, the Joulescope UI displays the red lines of the maximum and minimum value observed over that time window. You can change this setting using FilePreferencesWaveformshow_min_max. The Joulescope UI display the yellow line as the mean (average) value of all samples in that pixel’s time window. You can also view the standard deviation using a Single Marker. To add a Single Marker, right click on the x-axis, select AnnotationsSingle Marker. You can then left click on the single marker, move it to where you want, and then left click again.


Unfortunately, we do not have any automatic comparison methods yet, and we do not yet have the ability to display two waveforms at once. Both are important and planned [future features] (https://github.com/jetperch/pyjoulescope_ui/blob/master/features_future.md) (See Story 3). If you want to just compare energy or charge, you can simply write down and compare the numbers. However, I presume you want to compare waveforms. Today, you can open a second Joulescope UI to display the second waveform, and then visually inspect, perhaps using markers to help.

If you have some external plotting/comparison tool that you like, you can use Dual Markers to select the regions of interest, and then save a BIN file which contains alternating current/voltage float32 pairs. You can then open these BIN files in that tool.


I hope this helps! Please don’t hesitate to post again if you have any follow up questions or additional questions.

1 Like

Thank you for the explanation. It really helped me a lot! :grin:

There is only one problem I have doing the comparing method you described. Exporting the data between the Dual Markers is great, but when I zoom out over the time range that I measured (30 seconds), the values change into kA, kC and kV. Also the plot disappears.

image

Maybe it has something to do with the time I measured?

1 Like

Good to hear, and sorry that the display is misbehaving. I would guess that you had some sample drops during the capture which are poorly handled in the existing 0.5.x (and earlier) UI software. The upcoming 0.6 release fixes this issue here and here.

When you capture data, are you seeing a green USB indicator at the bottom right? It should look, like this:


If it is consistently red, then your setup is dropping more than 0.1% of samples. If it is red, I have a couple things to try. I have numerous reports that running in a VM does not work well due to the USB virtualization. If you are already running natively (not in a VM), try connecting to the USB port directly on your PC (no hubs or docks). I have reports that some hubs/docks seem to also prevent USB from keeping up with Joulescope’s data rate.

1 Like

Thanks a lot for the fast response!

The USB indicator is green while measuring, and I connected the Joulescope directly to the computer now instead of a USB-hub. Still have the same issue :frowning:. I think it has something to do with pausing the measurement. Because I have to measure a specific signal, first I have to pause the measurement and then add the Dual Markers for exporting the specific signal. Is that the right way to do so? Or do I need to record instead of using the Dual Markers for this purpose.

Hi @Groj. You should be able to hit the play/pause button, and then use the scroll wheel and left-click & pan left-right to navigate your data along the time axis.

What version of the Joulescope UI software are you using? You can click HelpAbout to double-check, and you should see 0.5.1:

You can download 0.5.1 here. If you are seeing this problem on 0.5.1, could you post your log Joulescope UI file? Assuming you are on Windows, the log files are recorded to:

C:\Users\{your_user_name}\AppData\Local\joulescope\log

The file name is the date/time stamp. Since it sounds like you are able to easily duplicate this issue, go ahead and do so, then close the Joulescope UI, and then post the most recent log file.

Hi @Groj - I received the logs that you sent through DM, and nothing looks unusual. I have tried and failed to duplicate what you are seeing with my 0.5.1 installation. However, the upcoming 0.6.x software has a bunch of fixes and improvements that are very related to what you are seeing.

Would you be willing to try out a 0.6.0 release to see if it fixes this issue? If so, I should be able to have something for you by the end of the day today (USA east coast time).

1 Like

I’m very willing to try out the new version!
Take your time, it’s to late for me to test it out today (UTC+2).

Thank you very much for all the help.

1 Like

Hi @Groj - We just published the Joulescope UI 0.6.0 which you can download from the Joulescope website. While we did go ahead and publish this version, it is still early in the test cycle, and we are not yet prompting anyone to upgrade. Try it out, and hopefully it fixes the issue you have observed. If not, please let me know what you see and please post the log file.

2 Likes

@Groj DM’ed me that 0.6.0 did not fix the issue. However, I was able to duplicate his behavior with some additional information he provided. We are investigating!

Hi @Groj - We just published the Joulescope UI 0.6.1 which you can download from the Joulescope website. This version fixes the recording issues that you reported:

  • Fixed “record” function not working on Windows due to multiprocessing and pyinstaller EXE packaging.
  • Applied calibration to “zoomed-out” data on dual marker export. All existing files created with dual marker export are invalid when the view window is more than a couple seconds (actual duration varies), but the zoomed-in data is still valid.

Any existing JLS files exported from earlier versions will not work when you are zoomed out. If you record a new file and zoom out, it will now work.

While we did go ahead and publish this version, it is still early in the test cycle, and we are not yet prompting anyone to upgrade. Try it out, and it should fix the issue you have observed. If not, please let me know what you see and please post the log file.

Thank you for your help, time and patience which allowed us to track down this issue!

1 Like

Hey there,

Everything works perfectly fine in 0.6.1! :smiley:
Thanks for the effort, now I can continue measure those tiny currents and easily compare signals between the dual markers with the export function.

1 Like