Hello
I was willing to ask for help regarding an issue I am seeing on my device. Even with outputs disconnected, is measuring around 100uAmps… and this makes my measurement totally wrong, as the current I am expecting to measure is around 75uAmps.
Is there a way we can run an automatic calibration of device? I dont recall this measuring wrong in the past.
The equipment has just been on my desk unused for a while, so IDK if one of the latest firmware updates of the GUI might have something to do with this issue?
Can you please help me out?
Hi @maxicor88 - Sorry to hear that you are having measurement issues with your Joulesocpe JS110.
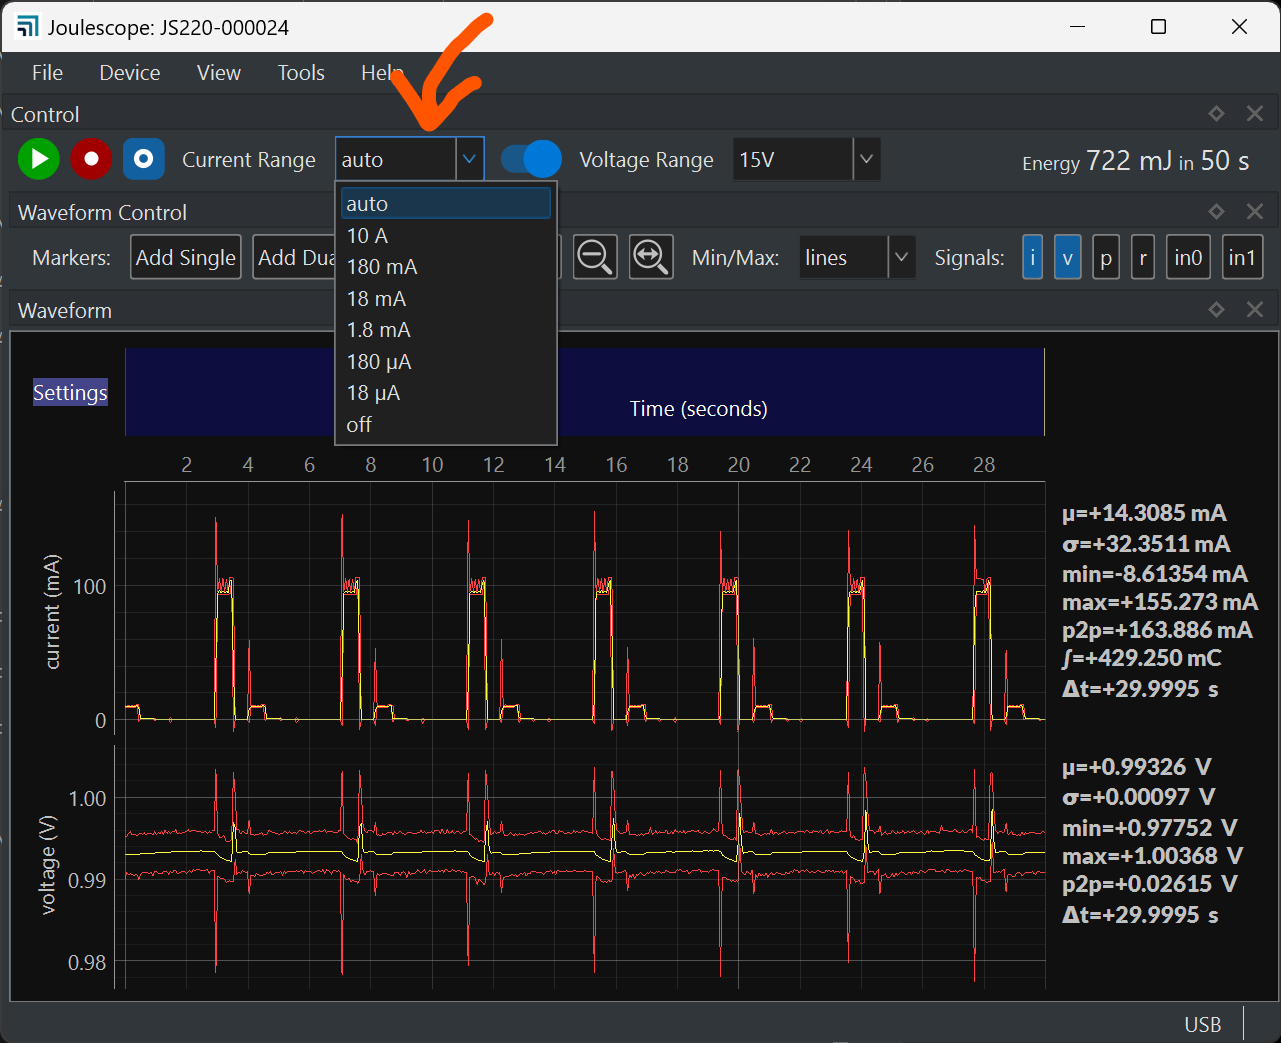
Can you confirm that the Current Range is set to auto?
You can change this using the Control Widget, like this:
If you are trying to use the Multimeter View, add the Control Widget and ensure that it is set to auto, too. With Joulescope UI 0.10.x and earlier, the device settings are attached to the views. When you switch views, the device settings can also change.
Thanks Matt to reach out so quickly
I tested your proposal and it worked.
I am wondering about this last sentence of yours “With Joulescope UI 0.10.x and earlier, the device settings are attached to the views. When you switch views, the device settings can also change.”’
Just trying to avoid this issue in the future, how can I prevent this from happening?
Regards
Maxi
another issue I just saw,
I was trying to sum out in time, my application requires me to monitor how the device works in a long period of time.
It seems the buffer was limited to 30 seconds
I tried changing it to 2 hours, but the application crashed.
Any hints?
Regards
Hi @maxicor88 - No need to worry! The settings change back to whatever you had set previously for that view, which is normally the desired behavior.
However, it can cause a problem. For example, if you add the Control widget to the Multimeter view, select a fixed current range, then remove the Control widget. Sometime later, you start the Joulescope UI, and forget that the Joulescope is still configured for the fixed current range in Multimeter view. Switching to Oscilloscope view, the Control Widget shows Current Range auto. However, this only applies to the Oscilloscope view, not the multimeter view.
This Joulescope UI behavior works for many users, but we have definitely seen some confusion. We are currently working on a major upgrade to the Joulescope UI. In this new version, we have Views that only affect the UI display. With this new version, toggling from the Multimeter view to the Oscilloscope view will not change the device behavior. The new version will separated have Profiles or Sessions (we have not picked the final name yet) that affect the device behavior, too.
This buffer is stored in your computer’s RAM. The Joulescope UI currently does not prevent you from allocating more RAM than your computer has. For details, see issue #172.
For longer captures you have two choices:
-
Record to JLS file, then load the JLS file for analysis. The JLS file is stored to disk, and is only limited by your storage media size.
-
Reduce the sampling frequency and use the RAM buffer. 30 seconds takes ~800 MB at 2 Msps. Reducing the sampling frequency to 10 kHz should fit in about 1 GB for a 2-hour buffer. Be sure to reduce the sampling_frequency FIRST before increasing the buffer_duration.
I will test changing those parameters and let you know
If you allow me to give my 2 cents, have you ever took a look at the UI of the Nordic Power Profiler?
It is simpler than joulescope, but it works quite well
I have a bunch of those at office too.
https://www.nordicsemi.com/Products/Development-hardware/Power-Profiler-Kit-2
I am familiar with the Nordic Power Profiler and Power Profiler II, but it has been a very long time since I checked out the UI.
Do you have any feedback or recommendations on how we could improve the Joulescope UI to better work for how you want to use it?
This is an screenshot of their latest version.
I highlighted some of the features I usually use:
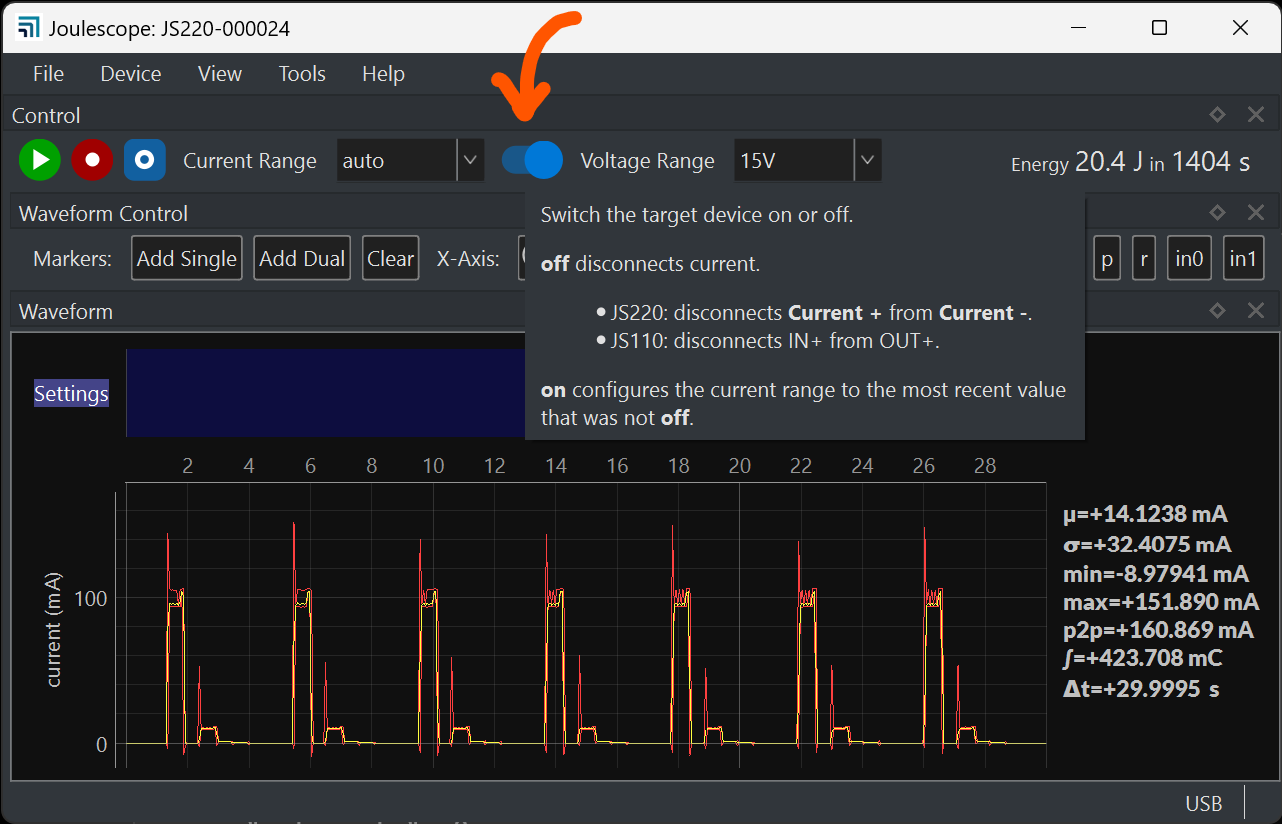
1- Allows to enable or disable to output: This allows me to easily reboot my device without touching the wires, or powereing my bench supply on or off. The profiler also allows to work as source, not only amperimeter, which up to 5V is very handy in most of my applications.
2- Allows to change the settings of the log, total period and frequency are interconnected, and it shows me the estimated memory consumption before I start the test. Once the test starts, I cannot change that, which prevents issues.
3- The markers (and I think this is something that Joulescope UI does it wrong) are linked to the samples, not the the graph. This way even if new data is coming, the markers are showing stable results of the portion of the plot I wanted to monitor.
4- Allows to pause the live data, the device still is getting samples in the background, but you can stop to study data more in deep for a while.
Thanks
Maxi
1 Like
Hi @maxicor88 - Thanks for taking the time to provide feedback!
Did you know that the Joulescope UI can also do (1):
- We definitely need to do a better job with allocating the RAM buffers. Work is already in progress

3 & 4: It is interesting that you do analysis on data collection still in progress. We originally had a way to scroll back in the live data stream. However, too many people got confused with the “delay”, so we anchored the right-hand side to the most recent data. The difference is that we did not pause the display and kept rolling through the circular buffer.
The Nordic software has a fixed buffer, not a circular buffer, and their software does not allow unbounded data collection. Recording “forever” (limited only by HDD or SSD storage) is a requirement for many of our customers. The Nordic software only allows the collection to a fixed RAM buffer, which is much simpler software. The tradeoff is that this makes allowing analysis of the data buffer while live streaming possible without strange effects when the data being observed is retired from a circular buffer.
Interestingly, it would not be difficult for us to add this same feature to fill one RAM buffer and stop. I’ll give this some more thought and see if it can be added without making the unbounded collection case more complicated.