So, I just thought of something. The use of a map prevents multiple assignments. While not a big deal for settings, it prevents the JLS file from issuing multiple !x_markers actions. Fixed!
Here is the updated jls_create.py script along with a generated JLS file.
# Copyright 2025 Jetperch LLC
#
# Licensed under the Apache License, Version 2.0 (the "License");
# you may not use this file except in compliance with the License.
# You may obtain a copy of the License at
#
#     http://www.apache.org/licenses/LICENSE-2.0
#
# Unless required by applicable law or agreed to in writing, software
# distributed under the License is distributed on an "AS IS" BASIS,
# WITHOUT WARRANTIES OR CONDITIONS OF ANY KIND, either express or implied.
# See the License for the specific language governing permissions and
# limitations under the License.


from pyjls import Writer, SignalType, DataType, time64
import argparse
import numpy as np


def parser():
    p = argparse.ArgumentParser(description='JLS generator.')
    p.add_argument('filename',
                   help='The output JLS file path')
    return p


def run():
    args = parser().parse_args()
    with Writer(args.filename) as wr:
        wr.source_def(source_id=1)
        wr.signal_def(
            signal_id=1,
            source_id=1,
            signal_type=SignalType.FSR,
            data_type=DataType.F32,
            sample_rate=1_000_000,
            name='current',
            units='A')
        s = np.zeros(1_000_000, dtype=np.float32)
        s[250_000:750_000] = 0.008
        s[250_000:300_000] = 0.012
        for idx in range(500_000, 750_000, 50_000):
            s[idx:(idx+25_000)] += 0.002
        r = np.random.default_rng().standard_normal(len(s), dtype=np.float64) * 0.05
        r += 1.0
        s *= r
        wr.fsr(1, 0, s)
        t = time64.now()
        second = time64.SECOND
        wr.utc(1, 0, t)
        metadata = {
          "id": "joulescope.ui.waveform_widget",
          "version": "1.0",
          "plots": {
            "i": {
              "range_mode": "manual",
              "range": [-0.002, 0.015],
            },
            "v": {
              "enabled": False,
            },
          },
          "settings": [
            ["show_min_max", "off"],
            ["show_statistics", False],
            ["control_location", "off"],
          ],
          "actions": [
            # adjust the x-axis range for fun
            ["!x_zoom_to", [t + int(second * 0.1), t + int(second * 0.9)]],
            # add a dual markers for fun
            ["!x_markers", ["add_dual", t + int(second * 0.245), t + int(second * 0.755)]],
            ["!x_markers", ["add_dual", t + int(second * 0.55), t + int(second * 0.575)]],
          ],
        }
        wr.user_data(0x400, metadata)


if __name__ == '__main__':
    run()
out.jls (4.0 MB)
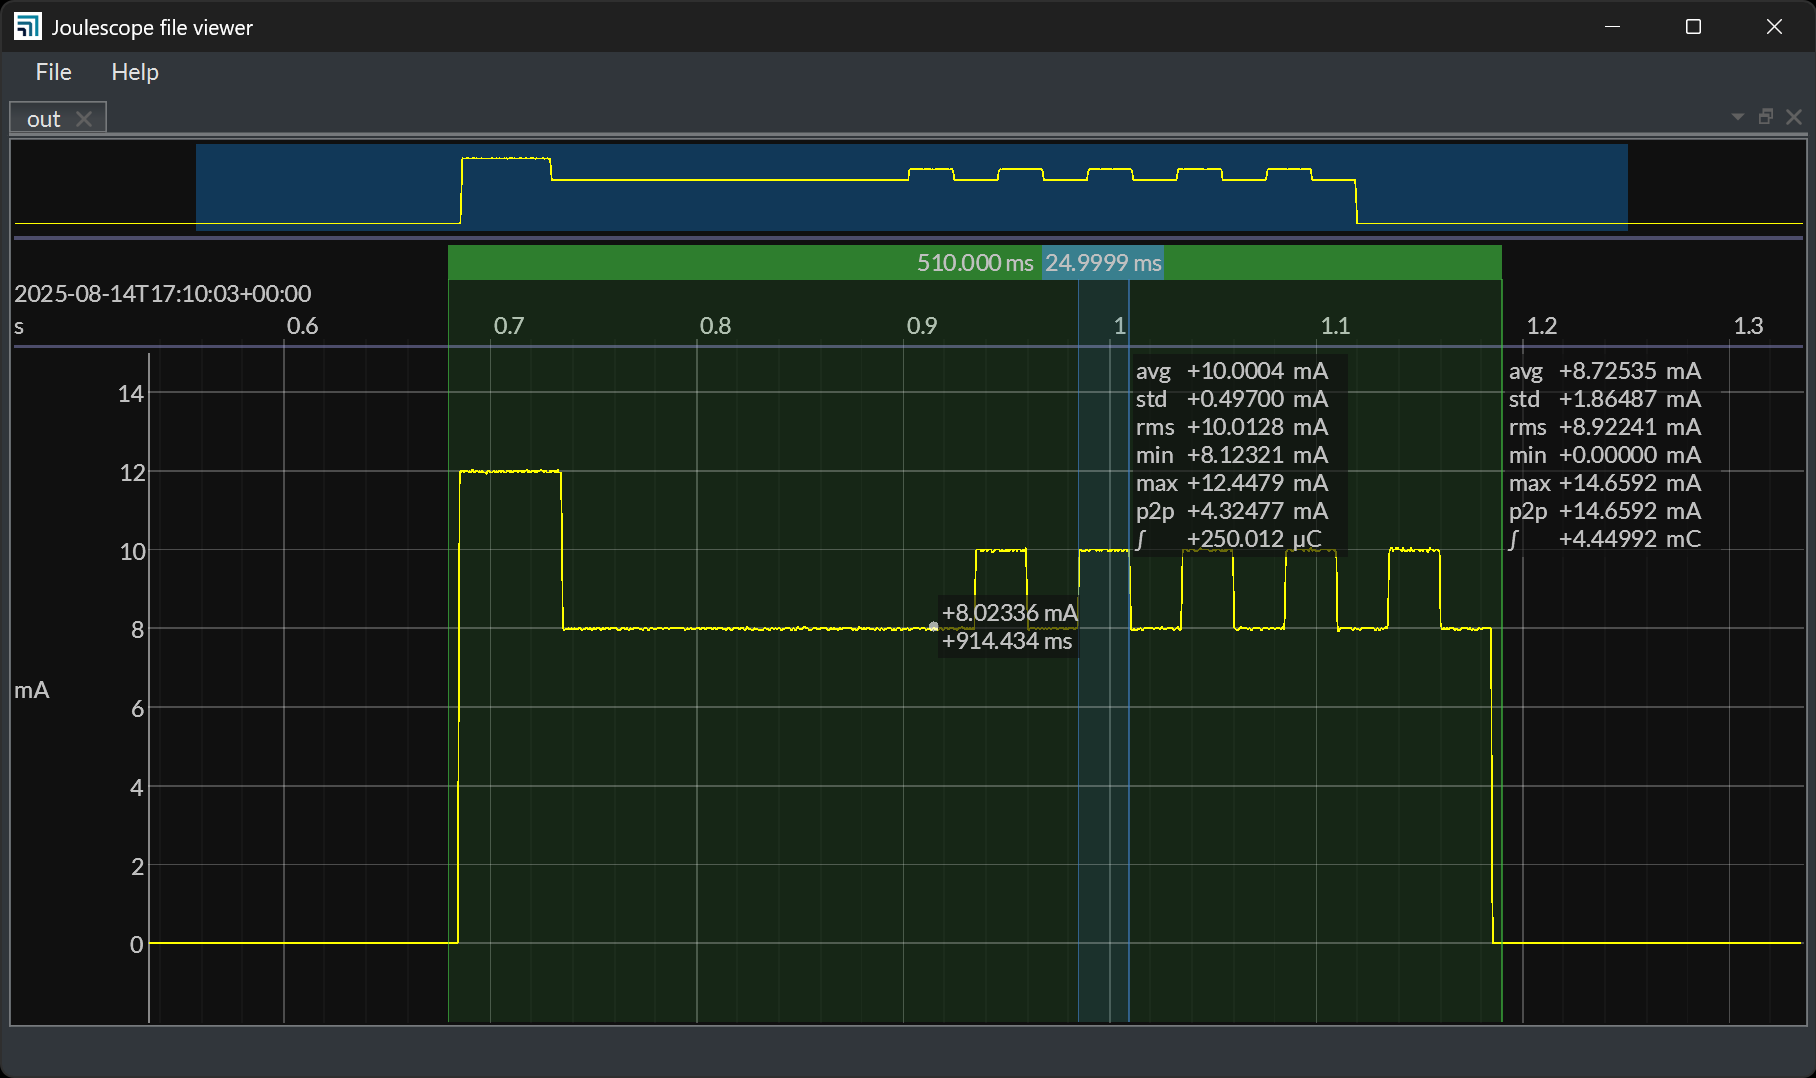
And here is how it looks when opened with the Joulescope UI: