Controlling the GUI programmatically -- can/cannot

rather than asking specific questions about specific GUI features, perhaps a general overview of what can (and cannot) be handled programmatically…

in my use-case, i’m generating .jls containing current (and likely voltage) data along with some marker-pairs highlighting events of interest…

the “default GUI state” when loading these .jls files via the JoulescopeViewer is quite overwhelming for the novice – who is simply viewing and not capturing signals… in general, what can i add to my .jls file to control the presentation…

there are also more “global” aspects of the GUI – numeric precision, choice of stats, y-axis scale, etc – which i can (sometimes??) get Joulescope to remember from session to session…

much like a Profile in vscode, it would be nice to persist (and then re-apply) numerous settings when launching Joulescope

finally, someway to execute Save Image to file would be great as a “batch mode” feature… i have many such images to paste into just as many documents…

Hi @biosbob -

1. Joulescope UI state

Let’s start with how the Joulescope UI stores state. The Joulescope UI stores state for each widget in each view on exit. The file is {userappdir}/joulescope/config/joulescope_ui_config.json. It also keeps historical settings in {userappdir}/joulescope/config/joulescope_ui_config.ZZZ.json.

Note that {userappdir} depends on the OS. The easiest way to find it is to select HelpView logs… in the Joulescope UI. Go up one directory and select the config directory.,

The Joulescope UI maintains state for JLS viewer mode separately. These are joulescope_ui_file_config.json and joulescope_ui_file_config.ZZZ.json.

You could edit these configuration files outside of the Joulescope UI to control your Joulescope UI experience. We definitely do not support this though :wink:

The JLS file also has some settings that get applied when you load it in the UI, as we discussed in Default view when loading a pre-generated jls file

2. Editing State

In the Joulescope UI, you can explore and edit nearly all state with the Settings widget. Note the tabs for Settings, Colors, Fonts, and Defines. Under the Widgets hierarchy, you can find the defaults for the Widget type and the specific settings for each of those Widgets in the current view. Widgets can provide other ways to manipulate this state, such as dedicated UI buttons.

Note that when you close a widget, you lose any settings changes for that widget. Adding a new widget of the same type starts with the defaults for that widget type. If you want to maintain different widget settings, you can add more views.

3. Programmatic Control

I am not entirely sure what you mean by this. The Joulescope UI does not have any scripting or automation tools today. I am thinking about adding a TCP/IP interface for both testing purposes and automation purposes. Today, you can add a plugin or modify the UI source code.

The UI uses Publish-Subscribe internally, and the application state discussed above lives as retained values in the PubSub instance. The PubSub instance is responsible for saving and restoring this state.

You can also explore the full PubSub mechanism. In the Settings widget, select UI and activate developer. You can add the Publish Spy and PubSub Explorer widgets to your view.

Since the Joulescope UI 1.0 and newer is all-in on PubSub and the command pattern, you can do everything programmatically that you can do with human UI interaction.

4. Waveform widget

The Waveform widget is complicated. I would love to have a bunch of free time to refactor the graphics presentation away from the Joulescope-y stuff to try to simplify this complexity, but that is not happening anytime soon. The widget has multiple modes of operation:

  1. Live streaming
  2. Paused viewing the capture buffer
  3. Viewing a JLS file from within a “normal” UI instance
  4. Viewing a JLS file form within a JLS “viewer” UI instance.

Due to the complexity, I am very reluctant to add significant new Waveform widget features unless they are broadly useful.

If I recall, I think your end goal is to capture Joulescope data using automation. You then analyze and display the results in another tool you create. Have you reached the limit where the Joulescope UI is really not the right tool?

5. Batch mode

Are you saying that you just want to convert a JLS file to a plot that you save as a PNG? Have you taken a look at the plot entry point for pyjls? It can generate an image programmatically using Matplotlib. We have not spent any time making this nice. It does not support annotations, either.
this is incredibly helpful and should be part of any developer’s documentation – if it isn’t already… there are many avenues for further study on my part, which i’ll investigate…

as for plotting, i’ve already implemented a command to generate an (embeddable) .html file which renders a plotly signal graph which has a similar look-and-feel to the Joulescope UI… the intent is for this to be a “figure” within some doc…

in the past, i would manually “compose” a snapshot within the GUI – zooming, annotating, etc… once setup, i would right-click and simply save the image… for documentation purposes this is fine (and for marketing purposes, consider adding your name/logo in the snapshot)…

my challenge is that i have dozens of such screenshots to generate and would (somehow) like to persist the setup… if this means doing a setup manually and then squiraling away some .json file, i’m fine with that…

or, if i understand the PubSub stuff, it sounds like i can launch a “headless” version of the UI and simply do stuff under program control… if i understand this correctly, this approach could be used in my own plot sub-command…

at the same time, i do have a common use-case where a generated .jls file (whose signal may have captured with a nordic PPK) is interactively explored using the Joulescope Viewer… for every one “writer” that actually uses a JS-220 to capture signals, i could have hundreds of “readers” that simply want to look at this data… clearly your Viewer shares much of its UI with the general capture software… anything i can do to effect a “default setup” would be helpful…

I added this description to dev.md. Also see pubsub.md and plugin.md.

I guess I am missing what part of this you want to automate. If you want to automate zooming (cropping) and annotating, then you need data analysis. These are not UI “Settings”. You can crop the JLS file to the region of interest and add annotations in a separate script.

Some questions:

  1. Can you be specific about the exact steps and settings you want to automate?
  2. What “default setup” do you want that is different from the normal JLS file viewer mode?
  3. Is this “default setup” and the screenshot generation through “batch mode” two different types of “settings”, or are they the same?
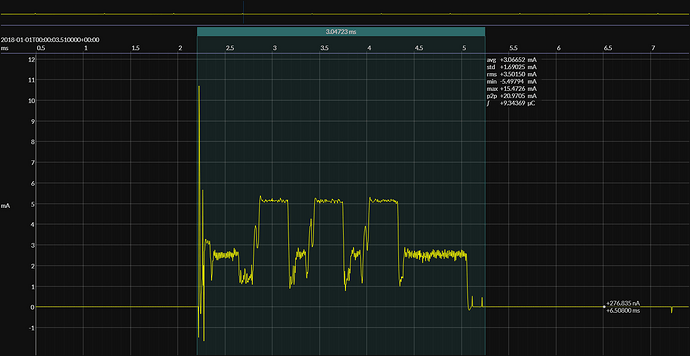
  4. Can you share a screen capture of the end result(s) that you want?

for sure, i can create a .jls file with just this subset of my total capture; and i can clearly the dual-marker under program control…

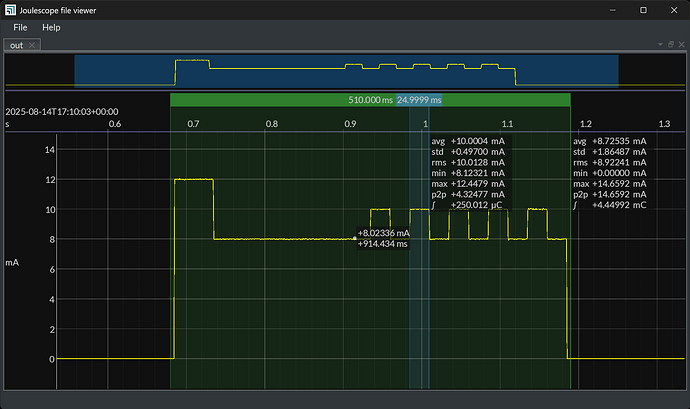
but you’ll notice that i’m only showing I; i had to switch of V… i’ve also set fill to *off, as well as turned off waveform stats… and in general, i might want to fix the y-axis range as well as tweak (and sometimes hide) other UI elements…

once everything “looks good”, i right-click and copy the image…

The Waveform “settings” user_data chunk included in the JLS file can control the plot settings. See the export code, import code and the available plot settings. You can use this mechanism to set the range_mode to manual, set the range, and disable the voltage plot.

However, it cannot control other Waveform widget settings like fill and statistics, at least in the existing production code. However, adding this feature ended up being trivial! JLS files can now generate arbitrary settings, events, and actions that are posted to the Waveform widget.

You can search waveform_widget.py for on_action_ for all the supported actions. An interesting one is !x_zoom_to implemented by method on_action_x_zoom_to. Note that events and actions need the leading ! that indicates unretained value to PubSub.

You then just need to add JSON-formatted user_data with metadata value 0x400 to the JLS file when you create it. Here is an example python script that generates a suitable JLS file:

EDIT: script removed: see next post

You can run the script like this:

python .\jls_create.py out.jls

I have also attached a JLS file that it created:
EDIT: JLS removed: see next post

Make sure you clone the Joulescope UI repo and use that code (not the official UI release) to open this file. Future official releases will include this feature.

This was a fun diversion to unlock the power of JLS files customizing the Waveform widget. I think the power is now in your hands :wink:

So, I just thought of something. The use of a map prevents multiple assignments. While not a big deal for settings, it prevents the JLS file from issuing multiple !x_markers actions. Fixed!

Here is the updated jls_create.py script along with a generated JLS file.

# Copyright 2025 Jetperch LLC
#
# Licensed under the Apache License, Version 2.0 (the "License");
# you may not use this file except in compliance with the License.
# You may obtain a copy of the License at
#
#     http://www.apache.org/licenses/LICENSE-2.0
#
# Unless required by applicable law or agreed to in writing, software
# distributed under the License is distributed on an "AS IS" BASIS,
# WITHOUT WARRANTIES OR CONDITIONS OF ANY KIND, either express or implied.
# See the License for the specific language governing permissions and
# limitations under the License.


from pyjls import Writer, SignalType, DataType, time64
import argparse
import numpy as np


def parser():
    p = argparse.ArgumentParser(description='JLS generator.')
    p.add_argument('filename',
                   help='The output JLS file path')
    return p


def run():
    args = parser().parse_args()
    with Writer(args.filename) as wr:
        wr.source_def(source_id=1)
        wr.signal_def(
            signal_id=1,
            source_id=1,
            signal_type=SignalType.FSR,
            data_type=DataType.F32,
            sample_rate=1_000_000,
            name='current',
            units='A')
        s = np.zeros(1_000_000, dtype=np.float32)
        s[250_000:750_000] = 0.008
        s[250_000:300_000] = 0.012
        for idx in range(500_000, 750_000, 50_000):
            s[idx:(idx+25_000)] += 0.002
        r = np.random.default_rng().standard_normal(len(s), dtype=np.float64) * 0.05
        r += 1.0
        s *= r
        wr.fsr(1, 0, s)
        t = time64.now()
        second = time64.SECOND
        wr.utc(1, 0, t)
        metadata = {
          "id": "joulescope.ui.waveform_widget",
          "version": "1.0",
          "plots": {
            "i": {
              "range_mode": "manual",
              "range": [-0.002, 0.015],
            },
            "v": {
              "enabled": False,
            },
          },
          "settings": [
            ["show_min_max", "off"],
            ["show_statistics", False],
            ["control_location", "off"],
          ],
          "actions": [
            # adjust the x-axis range for fun
            ["!x_zoom_to", [t + int(second * 0.1), t + int(second * 0.9)]],
            # add a dual markers for fun
            ["!x_markers", ["add_dual", t + int(second * 0.245), t + int(second * 0.755)]],
            ["!x_markers", ["add_dual", t + int(second * 0.55), t + int(second * 0.575)]],
          ],
        }
        wr.user_data(0x400, metadata)


if __name__ == '__main__':
    run()

out.jls (4.0 MB)

And here is how it looks when opened with the Joulescope UI: