Joulescope JS220 USB errors when connecting to a Raspberry PI4 64 bit device

I am running a Raspberry Pi 4 using raspbian(Bookwork(latest OS version as of this post). I was able to install the python library for Joulescope. I am have setup the udev permissions.

lsusb -d 16d0:10ba
Bus 001 Device 062: ID 16d0:10ba MCS Joulescope JS220

ls -al /dev/bus/usb/001/062
crw-rw-rw- 1 root plugdev 189, 61 Oct 30 11:20 /dev/bus/usb/001/062

joulescope info
System information
Python: 3.11.2 (main, Mar 13 2023, 12:18:29) [GCC 12.2.0]
Platform: Linux-6.1.0-rpi4-rpi-v8-aarch64-with-glibc2.36 (linux)
Processor:
executable: /usr/bin/python3
frozen: False

joulescope version: 1.1.9
Found 1 connected Joulescope:
JS220-000961 ctl=1.0.7 sensor=1.0.4

The Joulescope is plugged directly into the PI’s USB port.

The problem is that my script intermittently runs. I am running the 6 lines of starter code in the quick start guide. Sometimes I get a printed value of the average current/voltage.

I have changed the starter code to capture data over a 30s timespan and a 5 second timespan(up from the original 0.25 seconds).

bulk_in error 1
bulk_in error 1
bulk_in error 1
bulk_in error 1
API command u/js220/000961/@/!close invoked on jsdrv thread with timeout. Forcing timeout=0.
Traceback (most recent call last):
File “/garmin/e2e/pi-sw/e2e-node-software-pi/tools/Joulescope/DTF_joulescope.py”, line 30, in
u/js220/000961/s/i/ctrl but device already removed
current, voltage = measure_current()
^^^^^^^^^^^^^^^^^
File “/garmin/e2e/pi-sw/e2e-node-software-pi/tools/Joulescope/DTF_joulescope.py”, line 24, in measure_current
data = js.read(contiguous_duration=30) # read for 30 seconds
u/js220/000961/s/v/ctrl but device already removed
^^^^^^^^^^^^^^^^^^^^^^^^^^^^^^^
File “/home/garmin/.local/lib/python3.11/site-packages/joulescope/v1/device.py”, line 553, in read
u/js220/000961/s/p/ctrl but device already removed
start_id, end_id = self.stream_buffer.sample_id_range
^^^^^^^^^^^^^^^^^^^^^^^^^^^^^^^^^^
AttributeError: ‘NoneType’ object has no attribute ‘sample_id_range’
u/js220/000961/s/i/range/ctrl but device already removed
u/js220/000961/s/gpi/0/ctrl but device already removed
u/js220/000961/s/gpi/1/ctrl but device already removed

Let me know how to proceed.

Hi @s-nadella and welcome to the Joulescope forum!

Based upon your description, the USB communication is failing. When this occurs, what happens to the Controller Status and Sensor Status LEDs on the Joulescopes JS220?

You do want to ensure that your Raspberry Pi 4 has a big enough power supply for all connected peripherals. The JS220 draws close to the full 500 mA. You can check that the USB voltage remains around 5V at the Raspberry Pi and greater than 4.75V at the Joulescope JS220.

The joulescope python package now wraps pyjoulescope_driver. The joulescope package does add some significant extra processing, which could potentially cause problems if the Raspberry Pi 4 can’t keep up.

I understand that you are just trying to get started with this example. If you are able to share a little about what your end goal is, perhaps I can help figure out the best way to approach this. For example, if you only need lower-rate statistics data, that might help things if the Raspberry Pi if it’s a USB / CPU bandwidth issue.

For example, try this command:

python -m pyjoulescope_driver statistics --frequency 100

Hi Matt, thanks for your quick reply.
Looks like connecting the Joulescope to a powered hub seems to have fixed the USB issue.

We are looking to make micro amp scale measurements. We would like smooth out any spikes in power draw by measuring over the course of 30 seconds and taking the average.

Do you think the Pi is capable of keeping up with such measurements? If this is a problem, I can always slow it down to 30 - 1 second measurements?

Or would you suggest I call directly into the pyjoulescope driver?

Also, I figured I would just ask instead of hacking something together. Is there example code for measuring the power consumption over a certain duration? The example I have takes care of measuring current and voltage over a certain period of time. Or would I need to do the calculation myself?

Hi @s-nadella! I believe that you started with this example:

import joulescope
import numpy as np
with joulescope.scan_require_one(config='auto') as js:
    data = js.read(contiguous_duration=0.1)
current, voltage = np.mean(data, axis=0, dtype=np.float64)
print(f'{current} A, {voltage} V')

This example reads the full 1 Msps data from the JS220 into RAM, and then computes the mean over all samples to get the current and voltage. This is definitely overkill for what you want. You can use the statistics data. The statistics data is computed on instrument and dramatically lowers the data rate and host processing requirements.

The slowest statistics data rates is 1 Hz. If you just want average power, you can just get 31 statistics updates, subtract the ending energy from the starting energy and divide by 30. You can find the code for the pyjoulescope_driver statistics entry point here.

I also put together this quick example script which hopefully is close to what you have in mind:

# Copyright 2022-2023 Jetperch LLC
#
# Licensed under the Apache License, Version 2.0 (the "License");
# you may not use this file except in compliance with the License.
# You may obtain a copy of the License at
#
#     http://www.apache.org/licenses/LICENSE-2.0
#
# Unless required by applicable law or agreed to in writing, software
# distributed under the License is distributed on an "AS IS" BASIS,
# WITHOUT WARRANTIES OR CONDITIONS OF ANY KIND, either express or implied.
# See the License for the specific language governing permissions and
# limitations under the License.

from pyjoulescope_driver import Driver
import sys
import time


def _on_progress(fract, message):
    # The MIT License (MIT)
    # Copyright (c) 2016 Vladimir Ignatev
    #
    # Permission is hereby granted, free of charge, to any person obtaining
    # a copy of this software and associated documentation files (the "Software"),
    # to deal in the Software without restriction, including without limitation
    # the rights to use, copy, modify, merge, publish, distribute, sublicense,
    # and/or sell copies of the Software, and to permit persons to whom the Software
    # is furnished to do so, subject to the following conditions:
    #
    # The above copyright notice and this permission notice shall be included
    # in all copies or substantial portions of the Software.
    #
    # THE SOFTWARE IS PROVIDED "AS IS", WITHOUT WARRANTY OF ANY KIND, EXPRESS OR IMPLIED,
    # INCLUDING BUT NOT LIMITED TO THE WARRANTIES OF MERCHANTABILITY, FITNESS FOR A PARTICULAR
    # PURPOSE AND NONINFRINGEMENT. IN NO EVENT SHALL THE AUTHORS OR COPYRIGHT HOLDERS BE LIABLE
    # FOR ANY CLAIM, DAMAGES OR OTHER LIABILITY, WHETHER IN AN ACTION OF CONTRACT, TORT
    # OR OTHERWISE, ARISING FROM, OUT OF OR IN CONNECTION WITH THE SOFTWARE
    # OR THE USE OR OTHER DEALINGS IN THE SOFTWARE.
    fract = min(max(float(fract), 0.0), 1.0)
    bar_len = 25
    filled_len = int(round(bar_len * fract))
    percents = int(round(100.0 * fract))
    bar = '=' * filled_len + '-' * (bar_len - filled_len)

    msg = f'[{bar}] {percents:3d}% {message:40s}\r'
    sys.stdout.write(msg)
    sys.stdout.flush()


def measure_energy(driver, device, duration=None):
    """Measure energy over a duration.
    
    :param duration: The duration in seconds.
    :return: The tuple of energy, duration.
    """
    duration = 30 if duration is None else int(duration)
    data = []
    if duration <= 0:
        return 0, 0
    total_count = 10 * duration + 1  # need one extra since use first as a baseline
    
    def _on_statistics_value(topic, value):
        energy = value['accumulators']['energy']['value']
        data.append(energy)

    driver.subscribe(device + '/s/stats/value', 'pub', _on_statistics_value)
    try:
        while len(data) < total_count:
            time.sleep(0.050)
            duration_remaining = (total_count - len(data)) / 10
            _on_progress(len(data) / total_count, f' {duration_remaining:.1f} seconds left')
    except KeyboardInterrupt:
        pass
    finally:
        driver.unsubscribe(device + '/s/stats/value', _on_statistics_value)
    
    if len(data) > total_count:
        data = data[:total_count]
    actual_duration = (len(data) - 1) / 10.0
    return data[-1] - data[0], actual_duration
    

def run():
    duration = 30
    with Driver() as d:
        devices = d.device_paths()
        if len(devices) != 1:
            print('Found %d devices', len(devices))
            return 1
        device = devices[0]
        d.open(device)
        d.publish(device + '/s/i/range/mode', 'auto')
        d.publish(device + '/s/stats/scnt', 100_000)  # 10 Hz update rate
        d.publish(device + '/s/stats/ctrl', 1)
        energy, duration = measure_energy(d, device, duration=duration)
        power_avg = energy / duration
        print(f'\n{energy} J in {duration} s -> {power_avg} W average')
        d.publish(device + '/s/stats/ctrl', 0)
        d.close(device)


if __name__ == '__main__':
    sys.exit(run())
Greetings!

Just wanted to close this thread out by saying that using the powered USB hub fixed the USB problems, and the script you have attached is exactly what I wanted for power and energy consumption of a target device.

Appreciate your timely help, and sorry for not posting this sooner!

Yours sincerely,
Shreeyash Nadella

1 Like

@mliberty Sorry to bring this thread up again.

How do I increase the sampling frequency in the code example you added in the post above?

Hi @s-nadella - no worries!

You change this line:

d.publish(device + '/s/stats/scnt', 100_000) # 10 Hz update rate

The scnt settings is the number of samples per statistics update. If you have desired sampling frequency fs >= 1.0 Hz, then the equation is:

STATS_FS_BASE = 1_000_000
scnt = int(round(STATS_FS_BASE / fs))
fs_actual = STATS_FS_BASE / scnt
d.publish(device + '/s/stats/scnt', scnt)

However, you also need to update the duration computation. Right now, total_count is hard-coded for 10 Hz. You need to change this constant to fs_actual.

And to double check, the maximum sampling frequency is 1 million samples per second, i.e. a sampling frequency of 1MHz i.e. an fs(using the example above) of 1000000 ?

Would the Joulescope HW be able to run the example above using a 1MHz sampling frequency?

Let’s back up. The Joulescope JS220 always samples at 2,000,000 Hz. It then downsamples on-instrument to 1,000,000 Hz. At least for now, additional downsampling of the sample streaming data occurs on the host.

However, we are using the statistics streaming data. The statistics are computed over the full-rate 1,000,000 Hz on-instrument samples. scnt just determines how often the statistics are sent to the host. In this example, it also defines the duration quantization.

Decreasing scnt to increase the statistics streaming data output rate does not affect accuracy. The result of a 30 second measurement does not depend upon the scnt value. Changing scnt changes how often you get updates, which effectly changes the signal bandwidth.

Statistics cannot update at the full sample rate, and it makes no sense to do that. In the UI, we set the max to 100 Hz. In scripts, you can easily get 1,000 Hz, perhaps more. Beyond that, you really want sample data.

Oh. I guess I misunderstood it then.
So, with the example from Oct 30th, it is sampling at 1MHz. So, the value of power there, is the most accurate it can be.

For more context, I was trying to understand why my DUT has such a varied power reading. I saw the 10Hz comment in the example, and figured I was not sampling at a high enough rate.

So, sounds like it really is the DUT that has the varied reading, and has nothing to do with the Joulescope.

Hi @s-nadella - Yes, the energy value in the script is being computed over the 1,000,000 Hz power samples.

To double check that we are doing the right thing with the script, you can repeat the same experiment with the Joulescope UI. In the Waveform widget, enable dual markers and perhaps increase the memory buffer size. Alternatively you can record to JLS. Once you have captured the 30 second region, add dual markers and compare the energy (the power integral value).

Another way to check is to save the data to a file and compare them between runs.

Got it! Thanks for the timely response.
I will give those a try.

1 Like

Another question here, what is the shortest window of time I can compute these statistics over? I have been trying to measure current over 30 seconds. But that introduces some transient power spikes, that are blowing out the current/power measurements.

My solution to this is to take shorter duration measurements over the 30 seconds, and remove a certain percentage of erroneous data points.

Also, is there some sort of filtering I can apply using the Joulescope APIs to filter out these transient power spikes? These spikes are on the order of 40 mA over a couple 100 milliseconds.

Hi @s-nadella - Measuring energy consumption while selectively ignoring some time intervals usually gives bad results. The JS220 does not give “erroneous data points”, but measurement error does depend upon the current range. Let’s see if we can improve your test setup and JS220 configuration to give less measurement error.

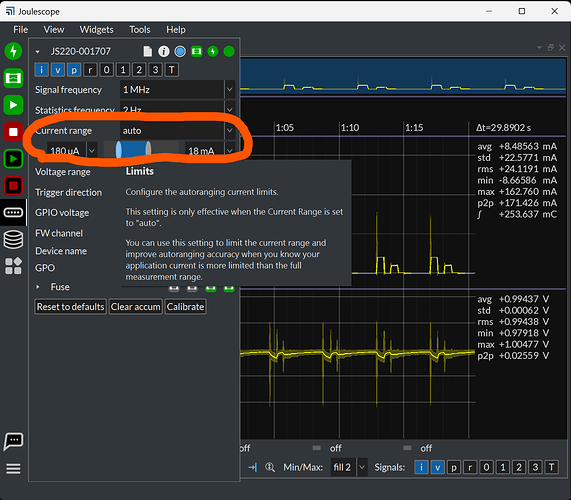
What is the range of the current consumed by your target device? The Joulescope current range switching can cause real current transients, especially on over-range when the shunt resistor value decreases. One way to help manage these is to tell your JS220 to limit the current range. Let’s see if this helps for you.

Start the Joulescope UI on a host computer (not the Raspberry Pi), and connect up your system. Ensure that you are using the default JS220 configurations at 1 MHz sampling rate. Set current range set to a fixed 10A and perform your experiment. What is the maximum current you measure?
Set the JS220’s fixed current range to the one that fits that current. Let’s say you see a maximum of 10 mA. In this case, you would select the 18 mA range.

Perform the measurement again and make sure everything looks good. You can now enable autoranging, but limit the current range extents. In the example above, use 18 µA to 18 mA. If you do not need the extra accuracy of the 18 µA range, you can select 180 µA as the minimum to possibly further reduce transients.

Perform your experiement again. Does the current stay within the maximum current range you selected?

Does this make sense? What do you find?

The average current draw at the 10A current range is 106.8 mA.
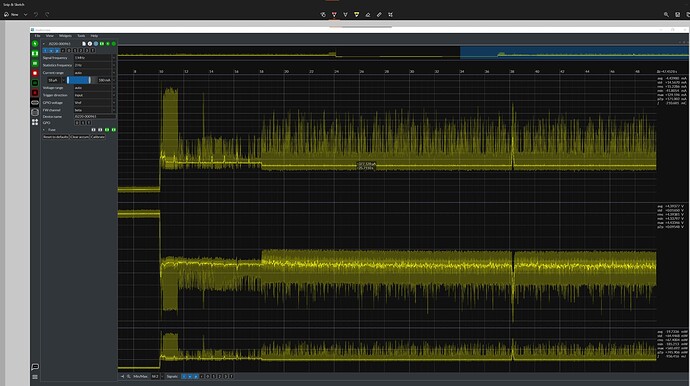
I set the current range to 180 mA. These power spikes are not a problem when the current draw is high ~100mA. It is a problem when the system current draw is low ~290-500 uA. See around the 38 second mark of the screen shot below.

I am trying to get filter/smooth out the spike at the 38 second mark.

Hi @s-nadella - You want to sent the current range to the maximum current draw you see, not the average. If the current ever exceeds the current range, then the measurement will saturate greatly increasing measurement error.

I do not understand why you want to filter out this spike. It looks like a real current event to me that consumes real energy.

However, you can perform whatever post-processing or digital filtering you would like on either the full-rate raw samples or the statistics data. You can increase the statistics rate up to 1 kHz in the script.

How do I go about gathering the raw rate samples? I imagine these are current, voltage and power measurements over 2MSamples/ second. Is this the example I had in my very first post?

import joulescope
import numpy as np
with joulescope.scan_require_one(config=‘auto’) as js:
data = js.read(contiguous_duration=0.1)
current, voltage = np.mean(data, axis=0, dtype=np.float64)
print(f’{current} A, {voltage} V’)

You are correct. It is a real current event. However, we are using system power as a psuedo measurement for the chip inside the system. Because we are concerned with determining the performance of this chip, these spikes(which have nothing to do with the chip, and occur at random intervals) are causing problems. That is why I am trying to get rid of them. It is not possible to isolate the current of the chip unfortunately. System power is the best we have.

Sounds like getting rid of them after the fact is the way to go. I would like your thoughts on if I should use the raw data(might be computationally expensive to do on a pi), or stick with the statistics data.

Thinking out loud here, if I use the raw data, I can store about 1 seconds worth of data, and keep computing a slow moving average. See if it is even possible to store the complete 30 seconds worth of data in ram and do computations on it.

I really don’t think you need full rate data just to filter out that spike. I can’t tell accurately from that image, but it looks like that spike is at least 100 ms in duration. You should be able to see it in 1 kHz statistics. Filtering it out is an exercise for the reader, especially if occurs at semi-random times.

You can simply capture the statistics data for as long as you want. You are not measuring energy directly as originally stated since you need to filter and then reintegrate.

For statistics frequency fs, you can compute:

scnt = int(round(1_000_000 / fs))

For duration seconds, you want to capture:

import math
count = int(math.ceil(duration / fs)) + 1

You can modify _on_statistics_value to do whatever you want with the data. Simply storing it is likely enough. Somewhere, likely after the capture, you need to post-process to “remove” these undesired spikes, then recompute energy by integrating power, which is simply each power average times the duration of each statistic.

Some more questions:

  1. How much error do those spikes add to your measurement? You can use dual markers in the Joulescope UI to see how much energy is in this spike and then compare to the total energy for this region.

  2. Does this amount of error matter?

  3. Is the unwanted spike energy consistent between measurements? If so, it may be easier to subtract a known error amount rather than filtering the signal to identify and remove the spikes.