Hello-
I have a JS220 where I am attempting to write data for some amount of time (10s in this example) to a jls file.
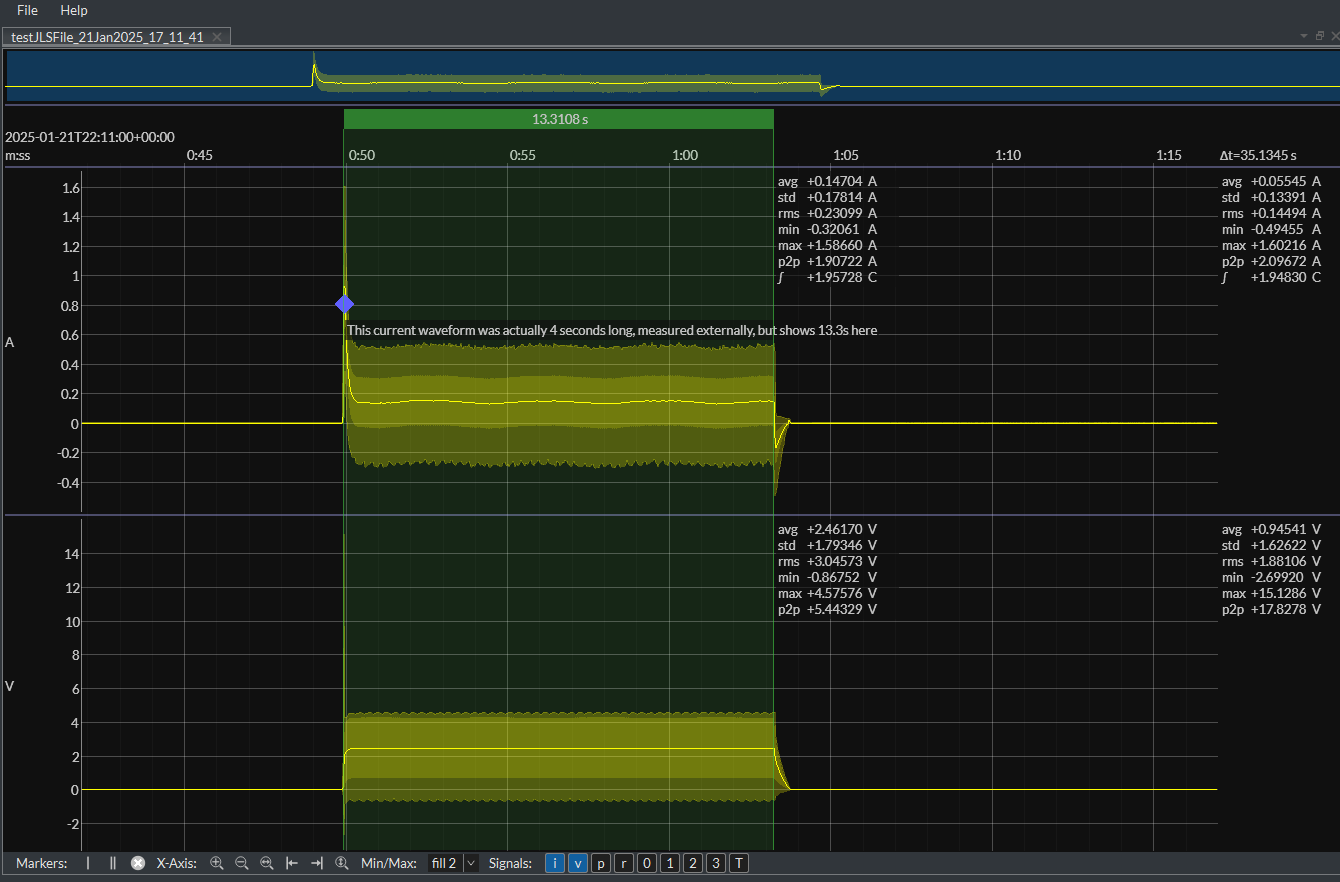
The following code works, however when I open the file in “Joulescope file viewer” 1.2.5 the timebase appears to be off by approx. 3.5x
Any help or guidance is appreciated.
from pyjoulescope_driver import Record
from pyjoulescope_driver import Driver
import time
from datetime import datetime


datestring = datetime.now().strftime("%d%b%Y_%H_%M_%S")

d = Driver()
device_path = d.device_paths()[0]
d.open(device_path, mode = 'defaults')
d.publish(f'{device_path}/s/i/range/mode', 'auto')
d.publish(f'{device_path}/s/i/range/select', '10 A')
d.publish(f'{device_path}/s/v/range/mode', 'auto')
d.publish(f'{device_path}/s/v/range/select', '15 V')
d.publish(f'{device_path}/h/fs', 1_000_000)
print(d.device_paths())
joulescope_writer = Record(d, device_path, signals=['current', 'voltage', 'T'])

print('Starting')
joulescope_writer.open(f'testJLSFile_{datestring}.jls')
print('waiting')

startTime = time.time()
#while(5 >= (time.time() - startTime)):
#    time.sleep(.001)
time.sleep(10)
print('closing')

joulescope_writer.close()
d.close(device_path)
Update:
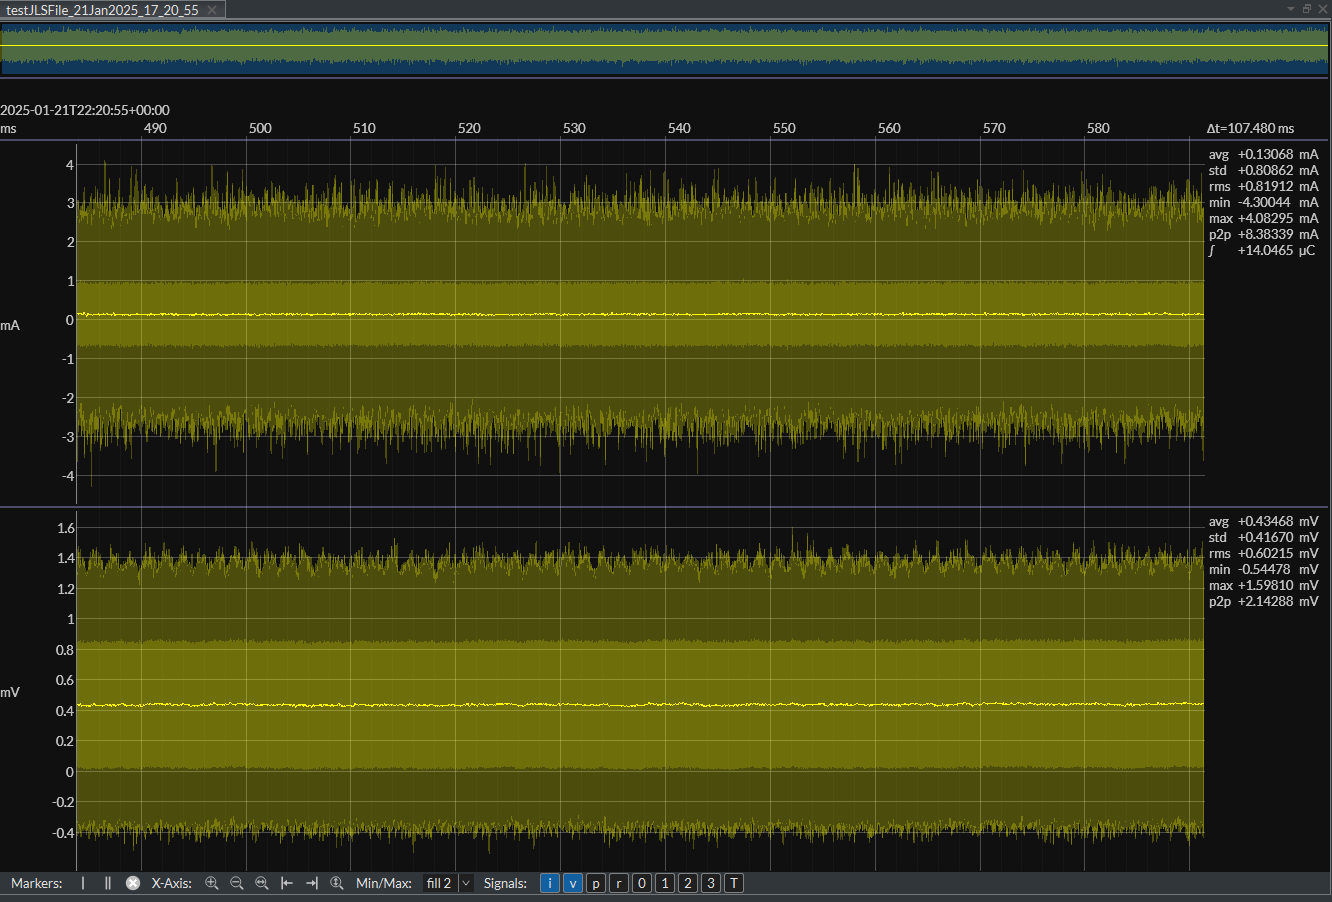
By changing the time to 5 seconds (from 10) the resulting time appears to be 107ms:
In addition, on the original 10s long capture, I exported the data to a CSV file using the pyjls export utility, and the number of samples is approx. 10,000,000 which is consistent with the 10 seconds of captured data at 1,000,000 samples/second that was specified.
Hi @awiesler and welcome to the Joulescope forum!
Can you confirm that you are using the latest pyjoulescope_driver and pyjls versions? The easiest way is:
python -m pyjoulescope_driver info
I see this:
PS C:\tmp> python -m pyjoulescope_driver info

    SYSTEM INFORMATION
    ------------------
    python               3.13.1 (tags/v3.13.1:0671451, Dec  3 2024, 19:06:28) [MSC v.1942 64 bit (AMD64)]
    python impl          CPython
    platform             Windows-11-10.0.26100-SP0
    processor            Intel64 Family 6 Model 183 Stepping 1, GenuineIntel
    CPU cores            24 physical, 32 total
    CPU frequency        3000 MHz (0 MHz min to 3000 MHz max)
    RAM                  41.5 GB available, 63.7 GB total (65.0%)

    PYTHON PACKAGE INFORMATION
    --------------------------
    jls                  0.11.1
    joulescope           1.2.0
    numpy                2.2.0
    pyjoulescope_driver  1.7.2


    JOULESCOPE INFORMATION
    ----------------------
    u/js220/002557: hw=1.0.0, fw=1.3.0, fpga=1.3.2

PS C:\tmp>
Hello-
Here’s my current status, looks like I may be ahead a version.:
    SYSTEM INFORMATION
    ------------------
    python               3.12.8 (tags/v3.12.8:2dc476b, Dec  3 2024, 19:30:04) [MSC v.1942 64 bit (AMD64)]
    python impl          CPython
    platform             Windows-11-10.0.22621-SP0
    processor            Intel64 Family 6 Model 154 Stepping 3, GenuineIntel
    CPU cores            14 physical, 20 total
    CPU frequency        1520 MHz (0 MHz min to 2400 MHz max)
    RAM                  17.9 GB available, 31.7 GB total (56.5%)

    PYTHON PACKAGE INFORMATION
    --------------------------
    jls                  0.11.1
    joulescope           1.2.0
    numpy                2.1.1
    pyjoulescope_driver  1.7.3
Hi @awiesler - I changed my setup to run Python 3.12.8 (was 3.13.1) and pyjoulescope_driver 1.7.3:
PS C:\tmp> python -m pyjoulescope_driver info

    SYSTEM INFORMATION
    ------------------
    python               3.12.8 (tags/v3.12.8:2dc476b, Dec  3 2024, 19:30:04) [MSC v.1942 64 bit (AMD64)]
    python impl          CPython
    platform             Windows-11-10.0.26100-SP0
    processor            Intel64 Family 6 Model 183 Stepping 1, GenuineIntel
    CPU cores            24 physical, 32 total
    CPU frequency        3000 MHz (0 MHz min to 3000 MHz max)
    RAM                  39.6 GB available, 63.7 GB total (62.1%)

    PYTHON PACKAGE INFORMATION
    --------------------------
    jls                  0.11.1
    joulescope           uninstalled
    numpy                2.2.2
    pyjoulescope_driver  1.7.3


    JOULESCOPE INFORMATION
    ----------------------
    u/js220/002557: hw=1.0.0, fw=1.3.0, fpga=1.3.2

PS C:\tmp>
I don’t see a JS220 listed in what you posted. Can you confirm that it shows fw=1.3.0, fpga=1.3.2?
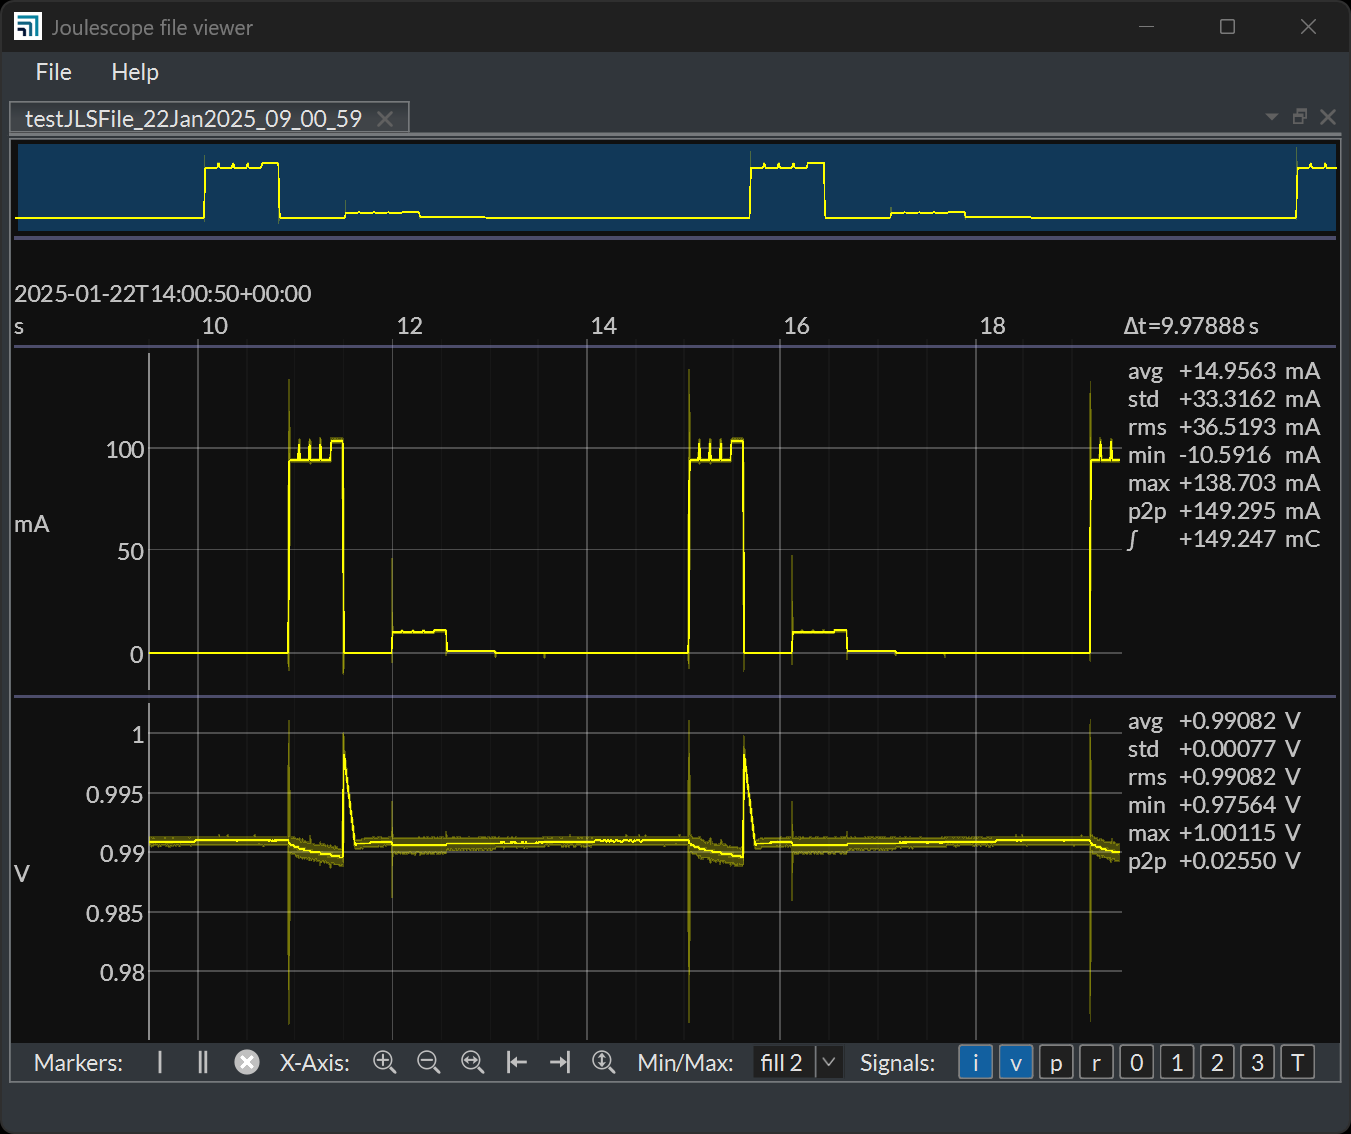
I tried running the script multiple times, but I consistently see 9.97888s duration captures on my computer:
Can you use the pyjls info command to display more detail about one of your misbehaving JLS files? You can use it like this:
PS C:\tmp> python -m pyjls info -v --utc .\testJLSFile_22Jan2025_09_00_59.jls
Sources:
    0: global_annotation_source
        vendor: jls
        model: -
        version: 1.0.0
        serial_number: -
    1: JS220-002557
        vendor: Jetperch
        model: JS220
        version:
        serial_number: 002557
Signals:
    0: 0.global_annotation_signal
        source_id: 0
        signal_type: 1
        data_type: 8196
        sample_rate: 0
        samples_per_data: 16
        sample_decimate_factor: 16
        entries_per_summary: 10
        summary_decimate_factor: 10
        annotation_decimate_factor: 100
        utc_decimate_factor: 100
        sample_id_offset: 0
        units:
        length: 0
    1: 1.current (9996210 samples at 1000000 Hz)
        source_id: 1
        signal_type: 0
        data_type: 8196
        sample_rate: 1000000
        samples_per_data: 8192
        sample_decimate_factor: 128
        entries_per_summary: 640
        summary_decimate_factor: 20
        annotation_decimate_factor: 100
        utc_decimate_factor: 100
        sample_id_offset: 104568437
        units: A
        length: 9996210
       0, 239218575350888902
       9979956, 239218586066785061
    2: 1.voltage (9996210 samples at 1000000 Hz)
        source_id: 1
        signal_type: 0
        data_type: 8196
        sample_rate: 1000000
        samples_per_data: 8192
        sample_decimate_factor: 128
        entries_per_summary: 640
        summary_decimate_factor: 20
        annotation_decimate_factor: 100
        utc_decimate_factor: 100
        sample_id_offset: 104568500
        units: V
        length: 9996210
       0, 239218575350956548
       9979956, 239218586066852707
    3: 1.trigger_in (19957760 samples at 2000000 Hz)
        source_id: 1
        signal_type: 0
        data_type: 259
        sample_rate: 2000000
        samples_per_data: 65536
        sample_decimate_factor: 1024
        entries_per_summary: 1280
        summary_decimate_factor: 20
        annotation_decimate_factor: 100
        utc_decimate_factor: 100
        sample_id_offset: 209137888
        units:
        length: 19957760
       0, 239218575351433289
       19857600, 239218586012401112
User Data:
PS C:\tmp>
Also ensure that your Joulescope is connected directly to your host computer, no USB hubs, docks or adapters.
Hello-
My output on the 10s file is as follows:
Sources:
    0: global_annotation_source
        vendor: jls
        model: -
        version: 1.0.0
        serial_number: -
    1: JS220-000908
        vendor: Jetperch
        model: JS220
        version:
        serial_number: 000908
Signals:
    0: 0.global_annotation_signal
        source_id: 0
        signal_type: 1
        data_type: 8196
        sample_rate: 0
        samples_per_data: 16
        sample_decimate_factor: 16
        entries_per_summary: 10
        summary_decimate_factor: 10
        annotation_decimate_factor: 100
        utc_decimate_factor: 100
        sample_id_offset: 0
        units:
        length: 0
    1: 1.current (9996210 samples at 1000000 Hz)
        source_id: 1
        signal_type: 0
        data_type: 8196
        sample_rate: 1000000
        samples_per_data: 8192
        sample_decimate_factor: 128
        entries_per_summary: 640
        summary_decimate_factor: 20
        annotation_decimate_factor: 100
        utc_decimate_factor: 100
        sample_id_offset: 2854564648
        units: A
        length: 9996210
       0, 239157417487025035
       9979956, 239157455151154859
    2: 1.voltage (9996210 samples at 1000000 Hz)
        source_id: 1
        signal_type: 0
        data_type: 8196
        sample_rate: 1000000
        samples_per_data: 8192
        sample_decimate_factor: 128
        entries_per_summary: 640
        summary_decimate_factor: 20
        annotation_decimate_factor: 100
        utc_decimate_factor: 100
        sample_id_offset: 2854564774
        units: V
        length: 9996210
       0, 239157417487027949
       9979956, 239157455151158036
    3: 1.trigger_in (19957760 samples at 2000000 Hz)
        source_id: 1
        signal_type: 0
        data_type: 259
        sample_rate: 2000000
        samples_per_data: 65536
        sample_decimate_factor: 1024
        entries_per_summary: 1280
        summary_decimate_factor: 20
        annotation_decimate_factor: 100
        utc_decimate_factor: 100
        sample_id_offset: 5709130624
        units:
        length: 19957760
       0, 239157417487040382
       19857600, 239157455149882058
User Data:
In addition, here is the hardware info:
    JOULESCOPE INFORMATION
    ----------------------
    u/js220/000908: hw=1.0.0, fw=1.3.0, fpga=1.3.2
Device is connected via supplied USB-A to USB-C cable directly connected to USB-A port on laptop.
Final update:
Between yesterday and today I rebooted both laptop and Joulescope, and now code is behaving as expected.
Should have tried that to begin with…
Thanks for the help!
Hi @awiesler - Great to hear things are working following the reboot.
The pyjls info output indicates the problem, but I don’t know why it occurred. If you look at the current section, you see some numbers:
       0, 239157417487025035
       9979956, 239157455151154859
This is the mapping from sample_id @ sample_rate to UTC time in 34Q30 fixed-point format as described in time.h. The duration is then:
(239157455151154859 - 239157417487025035) / 2**30 = 35 seconds
This matches your Joulescope UI image above. The duration should be approximately 10 seconds, which means the Joulescope UI Waveform widget display is stretched by about 3.5x as you observed.
The Joulescope UI JLS reader could be modified to detect this issue. It knows number of samples and sample_rate. If these are off by a significant amount from the UTC time map as computed here, it should override the time map using sample rate.
If you encounter this issue again, please post!