Writing to .jls file using JS Python driver

Joulescope software:

I’ve recently been able to produce .csv files related to measurements and wanted also to write similar data to .jls format as the software has tools for researching the measurement data.

The issue (perhaps my lack of knowledge) is that when I write to .jls file using the code below, I get a file missing data for the first ~3 minutes. I also get the printout shown below when running the code.

Do you have any suggestions on how I should proceed to get the file to start from 0s?

Also, I had an issue with initializing the measurement on a separate thread when using methods for streaming to .jls file, are you familiar with any such issues?

Code:

Printout:
jls code printout

Hi @crezle - I confirm that I get the same behavior with the code. Actually, it’s worse than you described. The initial delay seems to be the amount of time elapsed since the Joulescope JS220 was first opened.

I suspect the problem lies in the joulescope package, which wraps the new pyjoulescope_driver backend.

I know that the pyjoulescope_driver record entry point works correctly. For example:

python -m pyjoulescope_driver record --duration 10.0 --signals current,voltage,power out.jls

Does this work for you? You can call it programmatically, too. See this example which records a JLS file and then analyzes it:

# Copyright 2023 Jetperch LLC
#
# Licensed under the Apache License, Version 2.0 (the "License");
# you may not use this file except in compliance with the License.
# You may obtain a copy of the License at
#
#     http://www.apache.org/licenses/LICENSE-2.0
#
# Unless required by applicable law or agreed to in writing, software
# distributed under the License is distributed on an "AS IS" BASIS,
# WITHOUT WARRANTIES OR CONDITIONS OF ANY KIND, either express or implied.
# See the License for the specific language governing permissions and
# limitations under the License.


"""
Record Joulescope data and analyze.

To configure your computer:
1. Install python on your host computer
2. python -m pip install -U --upgrade-strategy eager pyjls pyjoulescope_driver numpy matplotlib

To run this script:
python record_analyze.py
"""


from pyjls import Reader, SignalType
from pyjoulescope_driver.__main__ import run as jsdrv_run
from pyjoulescope_driver import time64
import argparse
import matplotlib.pyplot as plt
import numpy as np


def get_parser():
    p = argparse.ArgumentParser(
        description='Record Joulescope data and analyze.',
    )
    p.add_argument('--duration',
                   type=time64.duration_to_seconds,
                   default=4.0,
                   help='The capture duration in float seconds. '
                        + 'Add a suffix for other units: s=seconds, m=minutes, h=hours, d=days')
    p.add_argument('--frequency', '-f',
                   type=int,
                   default=10000,
                   help='The sampling frequency in Hz.')
    p.add_argument('--signals',
                   default='current,voltage,power',
                   help='The comma-separated list of signals to capture which include '
                        + 'current, voltage, power.'
                        + 'Defaults to current,voltage,power.')
    p.add_argument('filename',
                   nargs='?',
                   default=time64.filename(),
                   help='The JLS filename to record. '
                        + 'If not provided, construct filename from current time.')
    return p


def record(args):
    # Record Joulescope data to a JLS file
    jsdrv_run(args=[
        'record', 
        '--frequency', str(args.frequency),
        '--duration', str(args.duration),
        '--signals', args.signals,
        args.filename])
    return args.filename, args.signals.split(',')


def load(filename, signal_names):
    # Load the recorded data
    data = {}
    with Reader(filename) as r:
        signals = []
        
        # time align signals (necessary for JS220.  JS110 already aligned, so does nothing)
        for signal_name in signal_names:
            s = r.signal_lookup(signal_name)
            print(f'signal {s.name}: offset={s.sample_id_offset}, length={s.length}, sample_rate={s.sample_rate}')
            signals.append(s)
        sample_id_offset = max([s.sample_id_offset for s in signals])
        length = min([s.sample_id_offset + s.length - sample_id_offset for s in signals])
        frequencies = [s.sample_rate for s in signals]
        if min(frequencies) != max(frequencies):
            raise RuntimeError(f'frequency mismatch: {frequencies}')
        frequency = min(frequencies)

        # extract the data for each signal
        x = np.arange(length, dtype=float) * (1.0 / frequency)
        for s in signals:
            data[s.name] = {
                'x': x,
                'y': r.fsr(s.signal_id, sample_id_offset - s.sample_id_offset, length),
                'name': s.name,
                'units': s.units,
            }
    return data


def analyze(data):
    # Perform custom analysis - plot and show the data
    f = plt.figure()
    ax1, ax = None, None
    for idx, d in enumerate(data.values()):
        ax = f.add_subplot(len(data), 1, idx + 1, sharex=ax1)
        if ax1 is None:
            ax.set_title('Analysis')
            ax1 = ax
        ax.grid(True)
        ax.set_ylabel(f'{d["name"]} ({d["units"]})')
        ax.plot(d['x'], d['y'])
    if ax is not None:
        ax.set_xlabel('Time (seconds)')
    plt.show()


def run(args=None):
    args = get_parser().parse_args(args)
    filename, signal_names = record(args)
    data = load(filename, signal_names)
    analyze(data)


if __name__ == '__main__':
    run()

The pyjoulescope_driver worked way better than my previous attempt with joulescope and now records for 10 seconds. I’ve currently one tried the command line style of approach as I’m writing this post, but I’ll try the programmatical approach after writing this post. I’ll just mention some observations as something question-ish way.

I’m guessing that the recording starts at ~2 seconds while the 0 second mark is when the Joulescope starts up/prepares to record, referring to this image;

The following error refers to either packet loss or data is not as expected in buffer?

Either way, thank you very much @mliberty, exceptional speed and quality of service!

Hi @crezle

With the new Joulescope UI 1.0, all times are UTC. If you look just above, you see the x-axis time offset 2023-07-11T06:55:30+00:00. The seconds below are offsets from this time. The initial samples then started at approximately 2023-07-11T06:55:32+00:00.

I also sometimes see fsr skip when running python -m pyjoulescope_driver record, but it seems to only happens at the very end when I either press CTRL-C or the duration expires. Does this match what you see? I’ll take a look and see if I can figure out how to make ending the capture consistently clean.

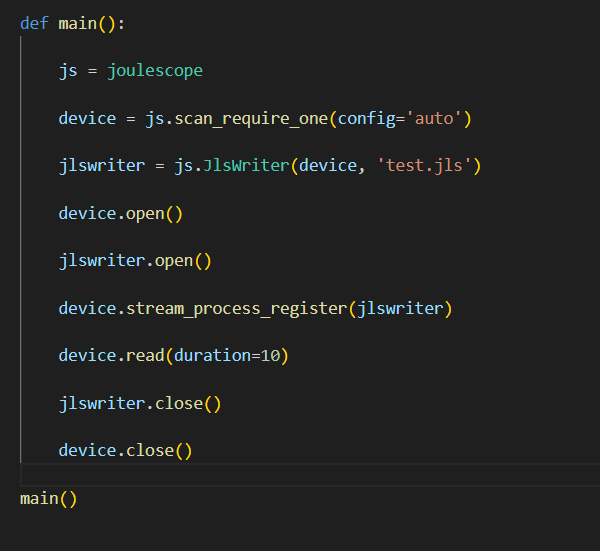
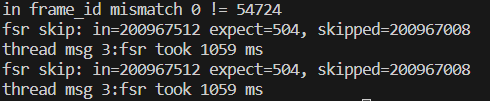
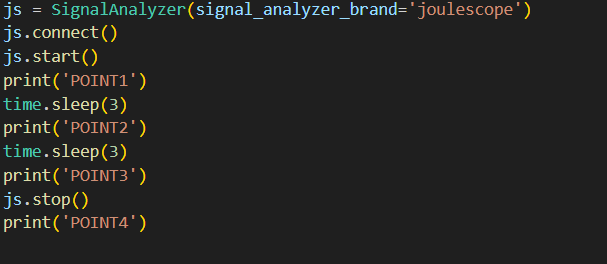
Below, I have a code (which can be interpreted as pseudocode in this context) and output where I indicate where the “skip” appear.

image
image

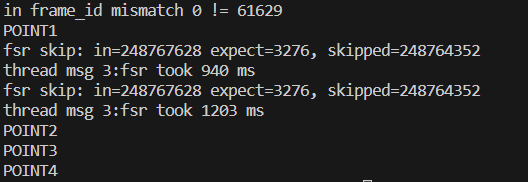
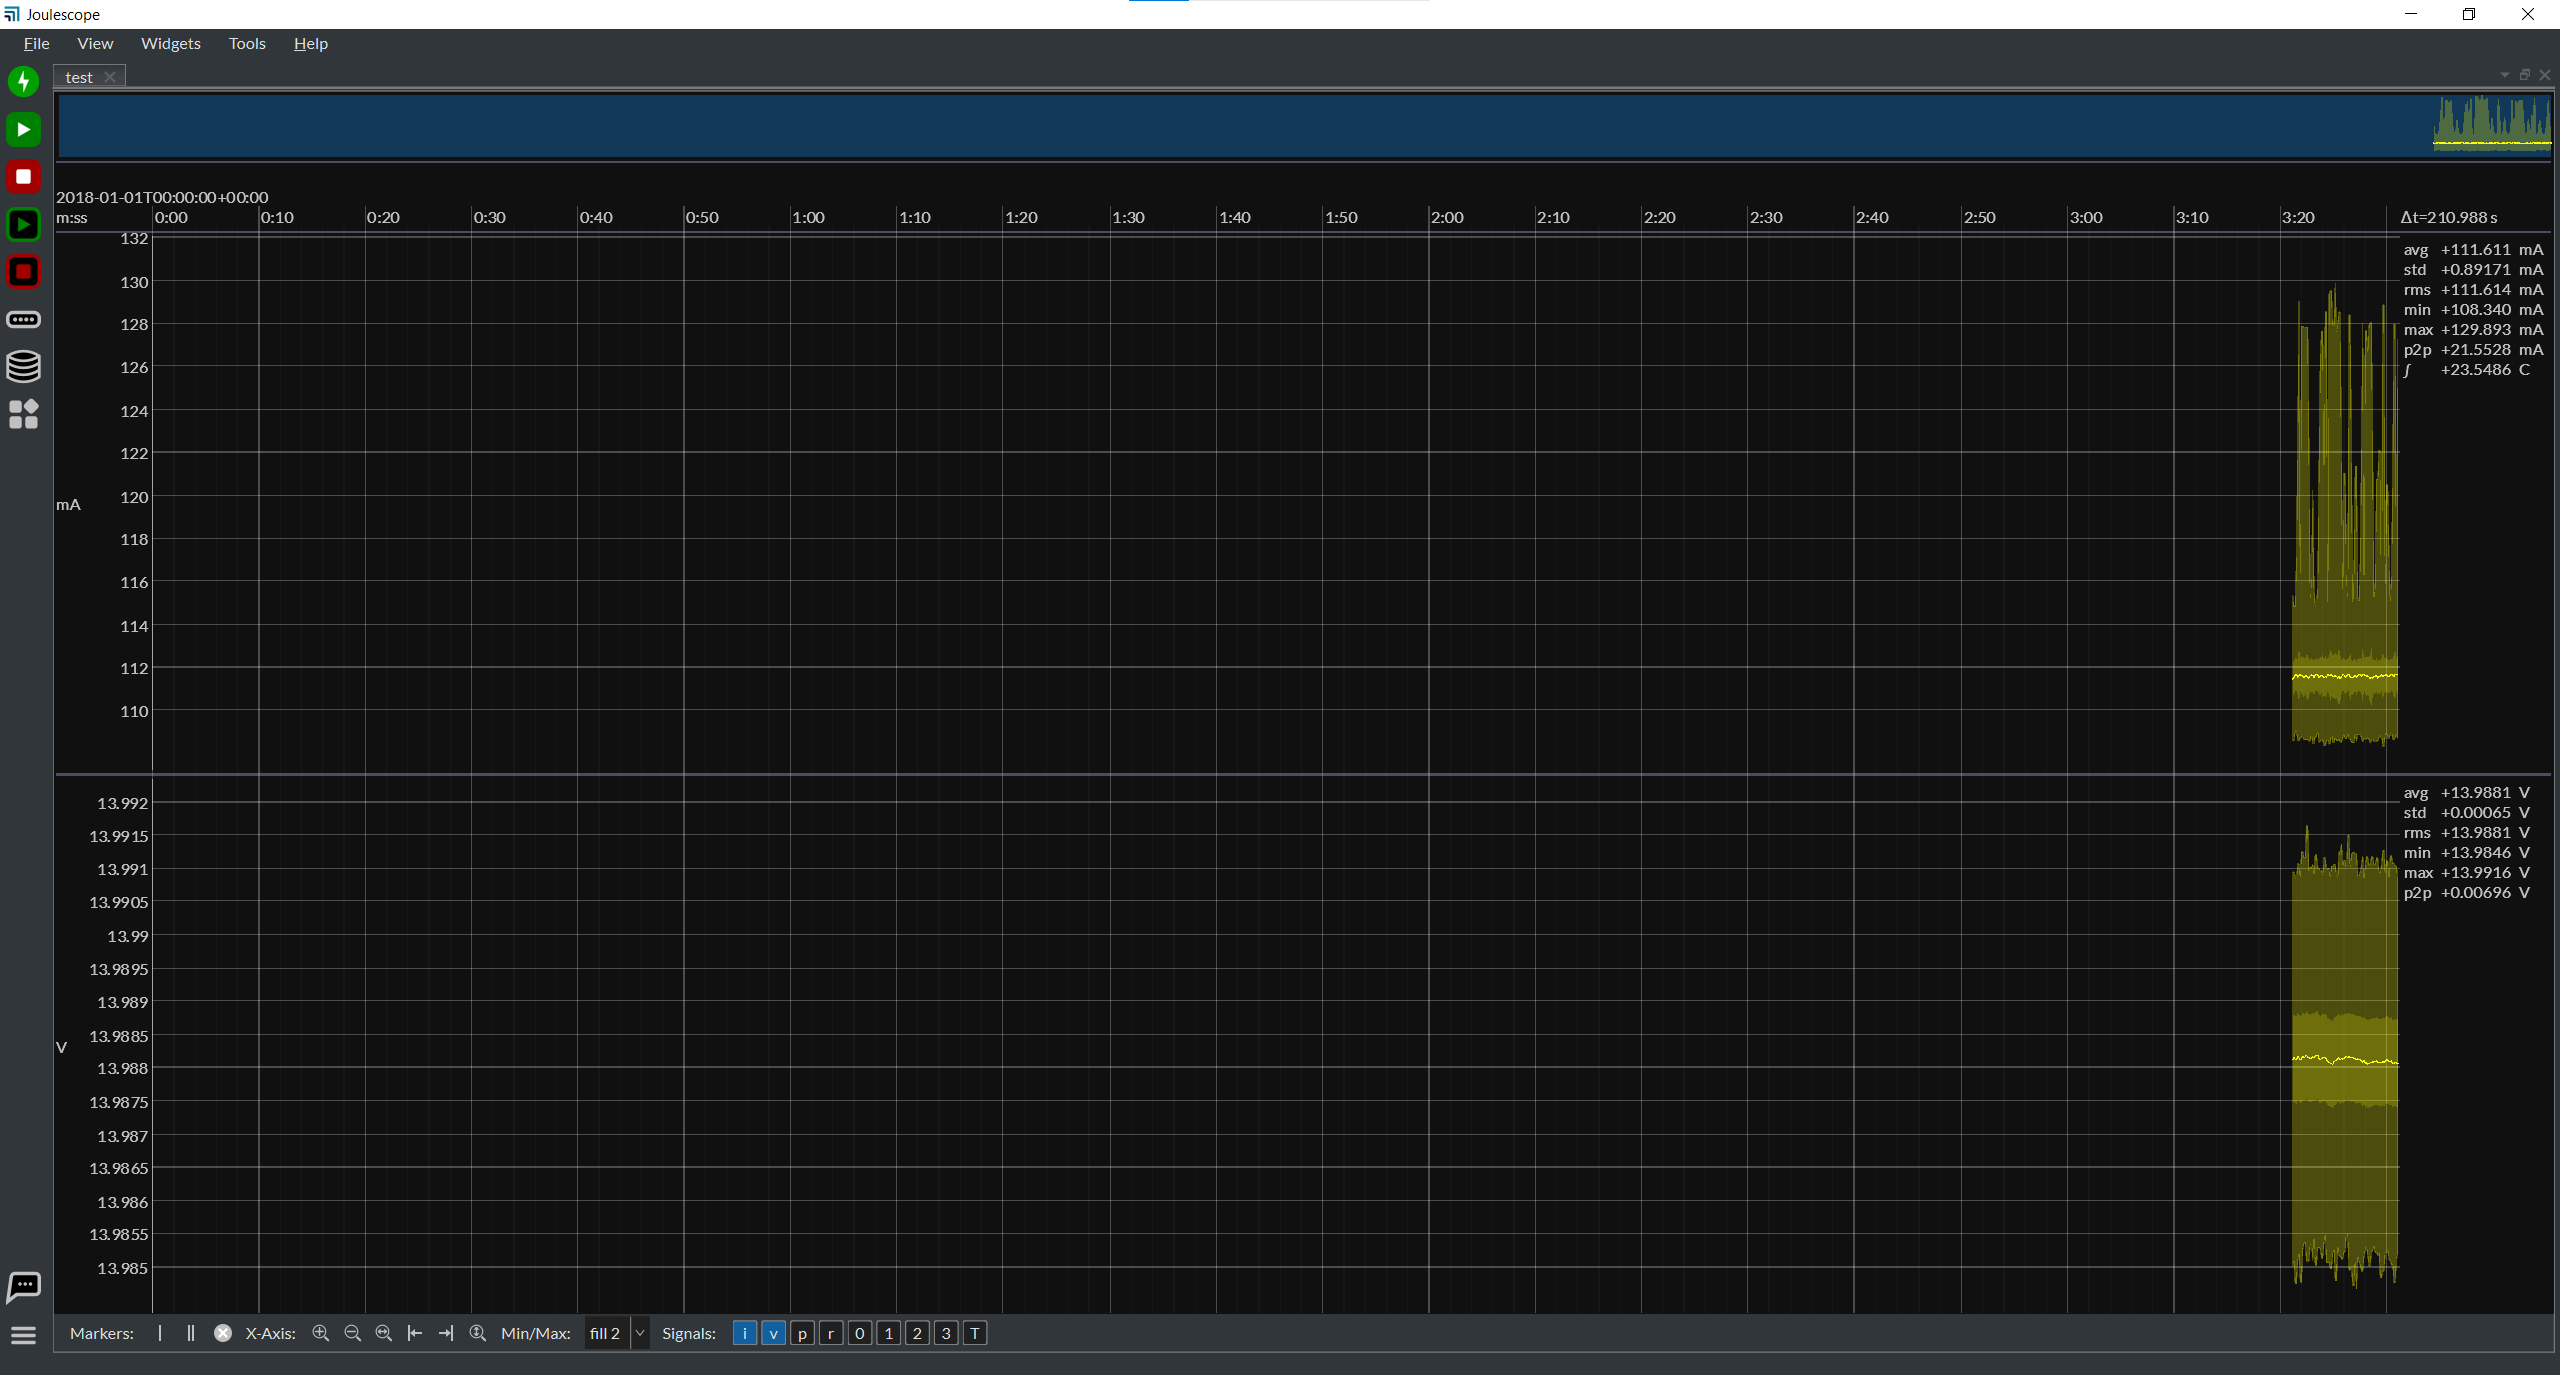
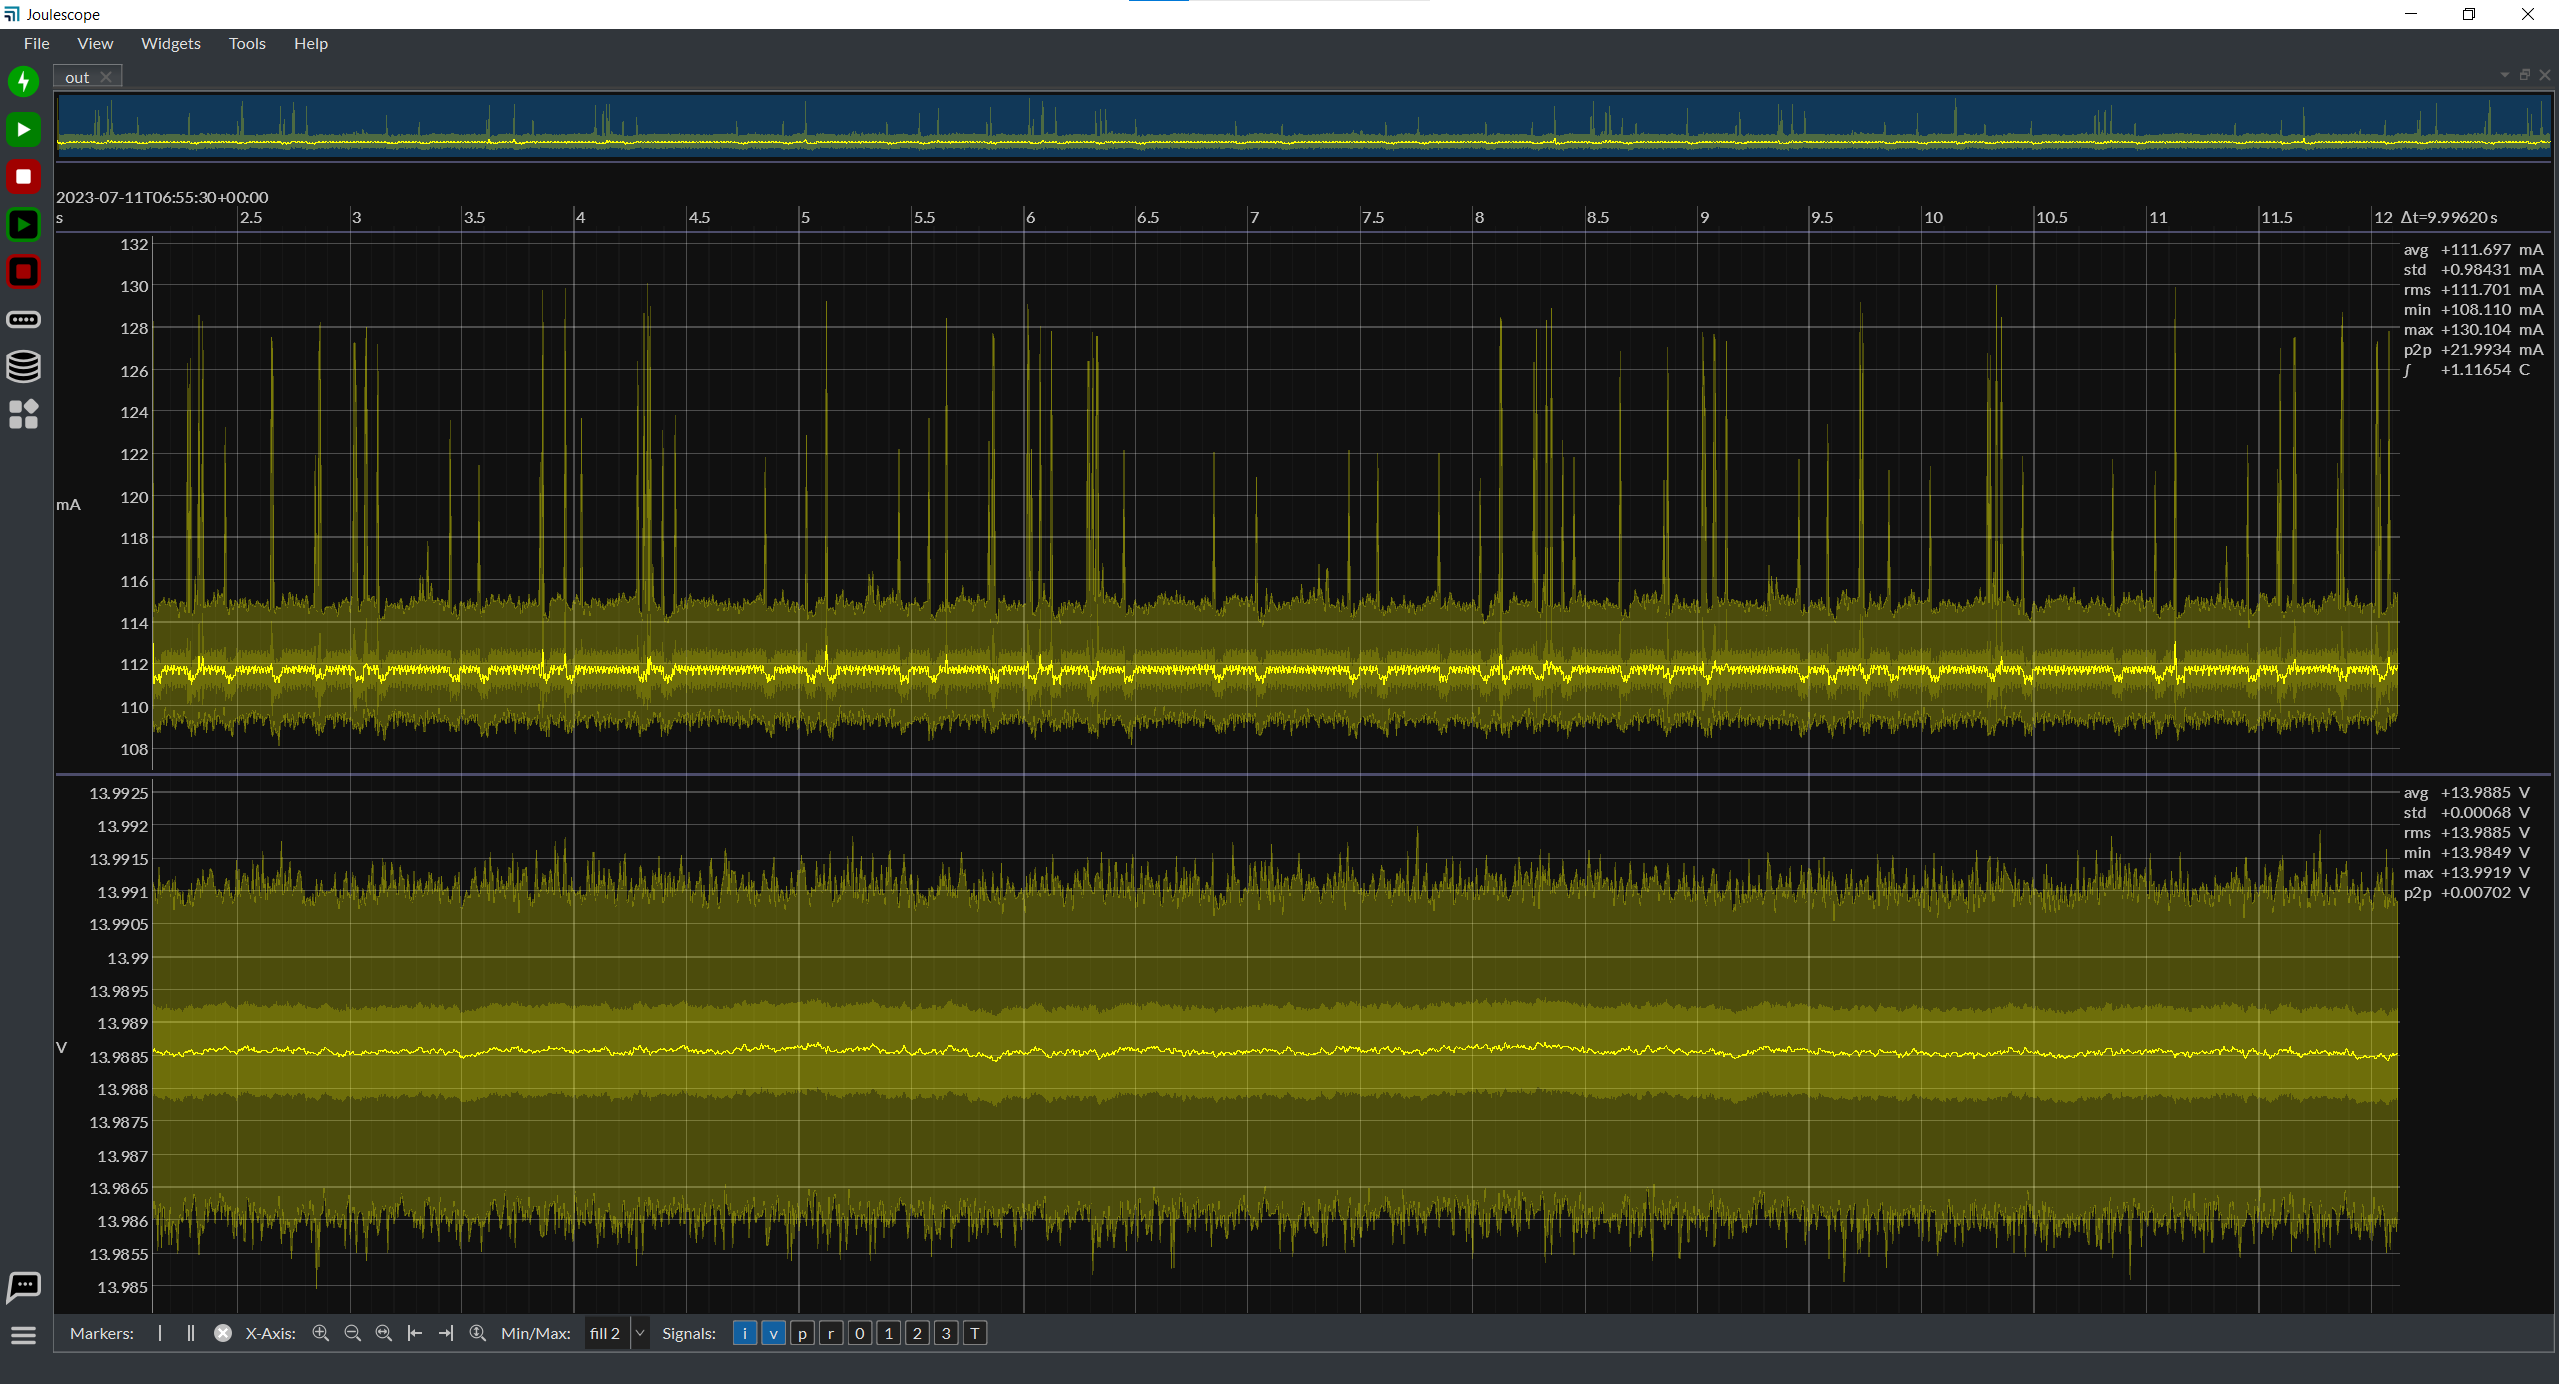
To me, it seems to be happening early in the process. I also detect this in the converted .csv file (from .jls) (Sampling frequency = 1000Hz)

time,current,voltage
0.0,-5.401671e-08,0.0024840143
0.001,-4.749745e-08,0.0025642468
0.002,-4.284084e-08,0.0025480436
0.003,-6.891787e-08,0.0025303029
0.004,-7.264316e-08,0.002540309
0.005,-6.053597e-08,0.0025325455
0.006,-7.264316e-08,0.0025331695
0.007,-7.636845e-08,0.0025186744
0.008,-7.264316e-08,0.0025588945
0.009000000000000001,-7.916242e-08,0.0025674133
0.01,-8.288771e-08,0.00256095
0.011,-8.195639e-08,0.002569857
0.012,-8.381903e-08,0.002550017
0.013000000000000001,-6.798655e-08,0.002543306
0.014,-6.053597e-08,0.0025718044
0.015,-6.61239e-08,0.0025843717
0.016,-6.239861e-08,0.002568148
0.017,-5.401671e-08,0.0025464306
0.018000000000000002,-4.9360096e-08,0.0025457004
0.019,-5.2154064e-08,0.0025195945
0.02,-5.2154064e-08,0.0025027487
0.021,-4.4703484e-08,0.0025146948
0.022,-3.8184226e-08,0.0025454294
0.023,-6.891787e-08,0.0025356747
0.024,-7.8231096e-08,0.002521269
0.025,-6.426126e-08,0.0025719907
0.026000000000000002,-7.357448e-08,0.0025738822
0.027,-7.7299774e-08,0.0025654603
0.028,-7.543713e-08,0.0026190989
0.029,nan,nan
0.03,nan,nan
0.031,nan,nan
0.032,nan,nan
0.033,nan,nan
0.034,nan,nan
0.035,nan,nan
0.036000000000000004,nan,nan

…continued…

431.681,nan,nan
431.682,nan,nan
431.683,nan,nan
431.684,nan,nan
431.685,nan,nan
431.68600000000004,nan,nan
431.687,nan,nan
431.688,nan,nan
431.689,nan,nan
431.69,nan,nan
431.69100000000003,nan,nan
431.692,nan,nan
431.693,nan,nan
431.694,nan,nan
431.695,-8.1025064e-08,0.0025817119
431.696,-7.8231096e-08,0.002595636
431.697,-7.7299774e-08,0.0026291562
431.69800000000004,-8.8475645e-08,0.0025607012
431.699,-6.61239e-08,0.0025456138
431.7,-6.053597e-08,0.002601483
431.701,-6.519258e-08,0.0025360603

This should be fixed along with Timestamp along with measurements using JS Python driver - #10 by mliberty. Let me know if you still see issues!

1 Like