Nan in current with pyjoulescope_driver

I captured i,v,p,0,1 data using pyjoulescope_driver.

① When reading out the captured jls file, current data has “nan” in 1st/2nd data for a while at the beginning (and 3rd/4th data are quite big).

② Also, data length is different.

I set --duration 5 --frequency 1000000, then I got;

  • gpi[0], gpi[1] : 5000000 (expected)
  • power/voltage : 5003152
  • current : 5019396.

I wonder why current data is strange at the beginning and different length in signals.
I appreciate your advice.

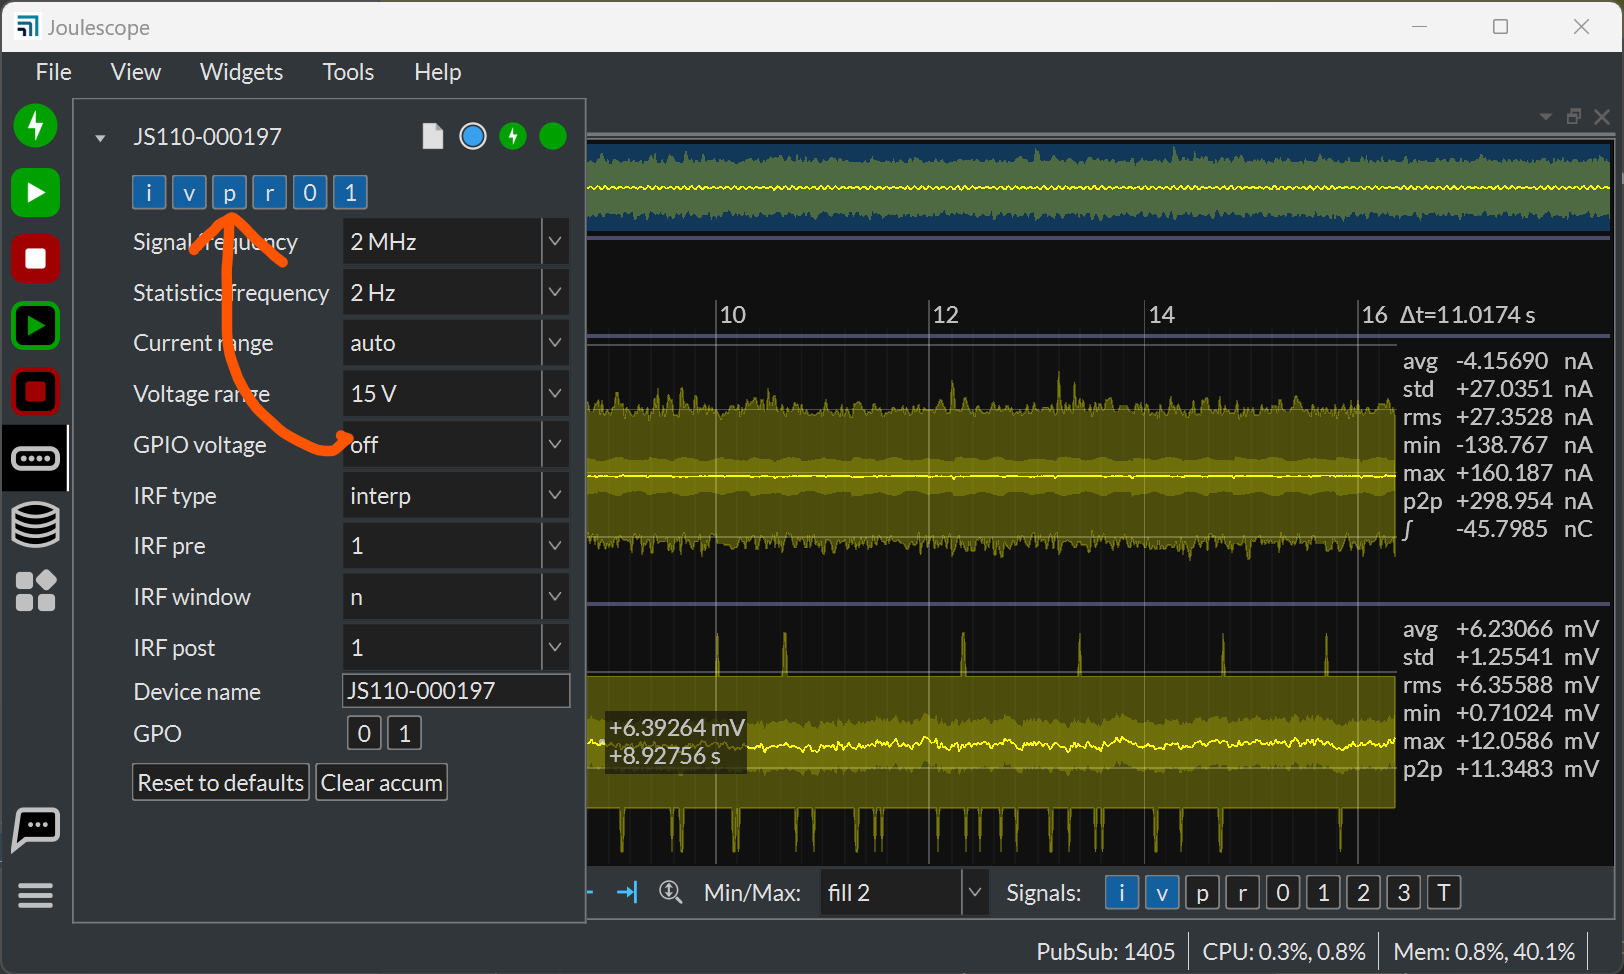
I also captured data using UI for comparison.
There is no “nan” or big value in current, although length is different between voltage/current and gpi[0]/gpi[1]

③ (I couldn’t select power data in UI, guessing it’s limitation in current version)

Environment:

  • Joulescope JS110
  • python 3.10.9
  • python modules: joulescope 1.1.3, pyjoulescope_driver 1.3.3, pyjls 0.5.3
  • Joulescope UI 1.0.9 (alpha)
  • command: python -m pyjoulescope_driver record --set “s/i/lsb_src=gpi0” --set “s/v/lsb_src=gpi1” --set “s/extio/voltage=1.8V” --duration 5 --frequency 1000000 --signals i,v,p,0,1 test.jls

Here is a test script to read out jls file.

from pyjls import Reader

jls_path = "test.jls"
signal_list = ['power', 'voltage', 'current', 'gpi[0]', 'gpi[1]']
r = Reader(jls_path)
for signal in signal_list:
    signals = [s for s in r.signals.values() if s.name == signal]
    if len(signals) == 0:
        print(f"no {signal} data.")
        continue
    data = r.fsr_statistics(signals[0].signal_id, 0, 1, signals[0].length)
    print(f"signal={signal}, length={signals[0].length}")
    print(f"data[0:5]=\n{data[0:5]}")

Result

[jls file from pyjoulescope_driver]
signal=power, length=5003152
data[0:5]=
[[0.00247067 0. 0.00247067 0.00247067]
[0.00247074 0. 0.00247074 0.00247074]
[0.00247058 0. 0.00247058 0.00247058]
[0.00247082 0. 0.00247082 0.00247082]
[0.00247203 0. 0.00247203 0.00247203]]
signal=voltage, length=5003152
data[0:5]=
[[1.82927263 0. 1.82927263 1.82927263]
[1.82927084 0. 1.82927084 1.82927084]
[1.82927585 0. 1.82927585 1.82927585]
[1.82926738 0. 1.82926738 1.82926738]
[1.82927716 0. 1.82927716 1.82927716]]
signal=current, length=5019396
data[0:5]=
[[ nan nan 1.79769313e+308 -1.79769313e+308]
[ nan nan 1.79769313e+308 -1.79769313e+308]
[ nan nan 1.79769313e+308 -1.79769313e+308]
[ nan nan 1.79769313e+308 -1.79769313e+308]
[ nan nan 1.79769313e+308 -1.79769313e+308]]
signal=gpi[0], length=5000000
data[0:5]=
[[1. 0. 1. 1.]
[1. 0. 1. 1.]
[1. 0. 1. 1.]
[1. 0. 1. 1.]
[1. 0. 1. 1.]]
signal=gpi[1], length=5000000
data[0:5]=
[[0. 0. 0. 0.]
[0. 0. 0. 0.]
[0. 0. 0. 0.]
[0. 0. 0. 0.]
[0. 0. 0. 0.]]

[jls file from JouleScope UI(1.0.9)]
no power data.
signal=voltage, length=13839888
data[0:5]=
[[1.82472885 0. 1.82472885 1.82472885]
[1.82700062 0. 1.82700062 1.82700062]
[1.82700062 0. 1.82700062 1.82700062]
[1.82700062 0. 1.82700062 1.82700062]
[1.82927239 0. 1.82927239 1.82927239]]
signal=current, length=13839888
data[0:5]=
[[0.00169455 0. 0.00169455 0.00169455]
[0.0018052 0. 0.0018052 0.0018052 ]
[0.00190987 0. 0.00190987 0.00190987]
[0.00198763 0. 0.00198763 0.00198763]
[0.00204744 0. 0.00204744 0.00204744]]
signal=gpi[0], length=13800000
data[0:5]=
[[1. 0. 1. 1.]
[1. 0. 1. 1.]
[1. 0. 1. 1.]
[1. 0. 1. 1.]
[1. 0. 1. 1.]]
signal=gpi[1], length=13800000
data[0:5]=
[[0. 0. 0. 0.]
[0. 0. 0. 0.]
[0. 0. 0. 0.]
[0. 0. 0. 0.]
[0. 0. 0. 0.]]

I edited your post to separate out the questions so that I could quote & respond.

With the record entry point, the JLS file will contain the first samples after enabling the Joulescope streaming. The JS110 has always had a race condition which often causes missing samples on start. Joulescopes use NaN to represent missing samples. While hopefully you do not see many, they can also happen if the USB streaming is interrupted by another device or the host computer deciding to do something else, like software updates, virus scanning, or backups.

With the --frequency 1000000 argument, you are specifying downsampling. Any NaN’s will then be computed into the filter. I looked at the downsampling code, and it does have NaN handling and initialization. However, if the first sample is NaN, then it will seed the entire filter with NaN. We should probably fix that. However, this should setting out very quickly. With your data, how many samples does it take to be correct?

When you record using the Joulescope UI, the Joulescope has already been streaming for some time, so you will not capture this initial bad data.

Different lengths are perfectly valid with JLS v2. Each signal is streamed separately and independently. With the existing Record implementation, we also do not guarantee that first samples from each signal are time aligned, either. You need to use the UTC data to ensure alignment. We could add additional code to the Record implementation to guarantee initial sample alignment and have the same length for each signal. However, that does not exist today. The Joulescope UI is perfectly happy with this.

I suspect that you turned off the power signal in the Device Control Widget. It needs to be on, like this:

Otherwise, when you start a recording, the “p” button will be grayed out.

With your data, how many samples does it take to be correct?

I take 3 sec measurement with power and gpi0/1. Then I check power behaviour when gpi0/1 changed by reading the captured data.
It should not be a problem as long as incorrect value (nan) happens only at the beginning.

With the existing Record implementation, we also do not guarantee that first samples from each signal are time aligned, either.

Oh, that’s a problem. I’d like to check power timing behaviour triggered by gpi0/1. I need signals to be time aligned. When opning a captured data by pyjoulescope_driver on UI, it looks time aligned.

You need to use the UTC data to ensure alignment.

I don’t know how to handle UTC data.
Any sample script to handle UTC time?

(BTW, fsr_statistics returns list of 4 data. Are they SummaryFSR.MEAN, STD, MAX, MIN in order?)

I suspect that you turned off the power signal in the Device Control Widget.

You’re rigtht. ‘p’ wasn’t ON at the Device Control Widget. Thank you.

Ok, so I think ① and ③ are answered. Making progress!

The order is mean, std, min, max. We need to improve the python documentation. You can find the underlying C definitions here.


So, that leaves ② regarding UTC time alignment. JLS v2 is designed to support multiple simultaneous devices at multiple sample rates, which does come at the cost of increased complexity. As you noted, the Joulescope UI uses the UTC time channel data to display the fully aligned signals. You can find the UI code here.

I think that your choices include:

  1. Stay with JLS v1 for now, which does have guaranteed alignment and gpi 0/1 support for JS110. However, JS220 support does not include the additional GPI or trigger signal.

  2. Record pre-aligned data to JLS v2 files (or any other file type of your choice) with sample buffers in your code. Your code buffers the incoming data for each signal, then writes only the needed, aligned data. You can use the pyjoulescope_driver.Record as an example to create JLS files.

  3. Record pre-aligned data to JLS v2 files with the provided joulescope_driver buffers. This API for this feature is pubsub only today, which may be a little confusing to use. The API is documented here and used here.

  4. Handle unaligned JLS v2 files.

Today, pyjls only provides pyjls.Reader.utc which invokes a callback with each UTC time channel entry. We do intend to move this UI code into the JLS code so that you can convert between UTC and sample_id for each signal. We could do this sooner rather than later.

I think that we would only need to add the following two methods to pyjls.Reader:

utc_to_sample_id(signal_id, time_utc)
sample_id_to_utc(signal_id, sample_id)

Note that JLS UTC time is an i64 integer, which is not the same as python UTC time. You can use pyjls.jls_to_utc and pyjls.utc_to_jls to convert. However, float64 (which python uses) does not have the same amount of precision. It’s better just to stay in JLS UTC time.

You would then use these functions to extract the data of interest. pyjls.Reader.signals already gives the map of signal_id to info, and the info contains the length in samples. You would find the event of interest in the gpi0 or gpi1 signal, map the sample_id to UTC, then use UTC to map back to sample_id for the other signals.


What do you think? What approach works best for you?

The order is mean, std, min, max.

I see. I thought order was mean, std, max, min, because of the data I posted above.
3rd data was positive while 4th was negative.

[ nan nan 1.79769313e+308 -1.79769313e+308]


Regarding options you suggested, it sounds all 1-3 options requires change in capture process, not in extraction process. Am I correct?
I thought I need change in extraction of JLS file, because UI looks no issue with time-alignment when opening JLS file which was captured by pyjoulescope_driver.

Option 1: I’ve already moved to JLS v2 so that I’d like to avoid to go back…
Option 2&3: It sounds I need to make own reader based on pyjoulescope_driver.Recorder. Correct?
Option 4: I don’t know how to handle JLS v2 files to be time-aligned.

I wonder how UTC feature is related to option 2&3. Or is it another option? With UTC, I don’t need to change capture process, but extraction process needs to be implemented referring to UI code. Correct?

It seems use of JLS v1 is more feasible. But I may misunderstand your suggestions.

Correct, Options 1-3 record aligned samples. Option 4 processes the unaligned samples correctly. All options are feasible. Option 1 is the least amount of work, since it already just works. The other options require some effort.

I can support Option 4 by adding utc_to_sample_id and sample_id_to_utc. Your code would have to use these to convert between the sample_ids for each signal. Is it clear how your analysis code would need to use these?

I’d like to keep using JLS v2 rather than going back to JLS v1, but it depends on effort for Option 4.

Let me crarify.

  • You’ll provide code of utc_to_sample_id and sample_id_to_utc.
  • I extract data using pyjls.Reader and find a sample_id which is a sampling point I’m iterested to start analysis. (I need to know how to get a sample_id)
  • Convert the sample_id to utc by sample_id_to_utc for gpi0 (or 1) data.
  • Do same conversion with other signals(power/current/voltage) and find same utc (or closest?), then convert back the utc to sample_id for the signals by utc_to_sample_id.

Correct?

pyjls.Reader.signals already gives the map of signal_id to info, and the info contains the length in samples.

What is ‘info’? I can get length (for gpi[0]) like this, can’t I?

from pyjls import Reader

jls = Reader(jls_path)
signal = [s for s in jls.signals.values() if s.name == 'gpi[0]']
print(signal[0].name)
print(signal[0].length)
print(signal[0].signal_id)

Yes, the process sounds correct, and your example for getting the gpi[0] signal is correct. I recommend adding a check that there is one and only one gpi[0] signal, but that’s for better error handling.

I will start on the utc_to_sample_id and sample_id_to_utc code today, which will be added to pyjls.Reader. Since this is already working from the UI, it should hopefully go quickly! I’ll post again here with progress by the end of my day (UTC-4).

1 Like

Hi @kenta - I’ve made progress, but nothing ready to share yet. I discovered another issue with JLS sample_id mismatch between the fixed-sampling rate data stream and the UTC entries when the first sample_id does not start from zero. All JLS v2 recorder usages guarantee an initial sample_id of zero, which is why I have yet to see this issue in the field. However, this issue definitely affects the UTC ↔ sample_id conversions.

I have made progress, but the sample_id shows up in many places inside the JLS v2 file format. I need to be slow and careful to get this right, so it may take a few days.

Hi @kenta - You can now update to pyjls 0.6.0:

python3 -m pip install -U pyjls

Note that the new pyjls.Reader methods are sample_id_to_timestamp and timestamp_to_sample_id. You can now use sample_id_to_timestamp on one channel and then timestamp_to_sample_id on another channel to get the corresponding samples.

Let me know how it goes!

1 Like

Thank you for new pyjls. It looks working as expected (time aligned).

Is ‘sample_id’ a index of sampling data? When signal data length is 100, then sample_id is 0 to 99.
Correct?

And could you check the following test code if I use the methods correctly?

I have a jls file containing ‘power’, 'gpi[0], 'gpi[1] captured with 100kHz for 3 sec by pyjoulescoe_driver.
Intention is to align time to one of signals which has the latest timestamp at sample_id=0.

r = Reader(jls_path)
signal_list = ['power', 'gpi[0]', 'gpi[1]']
signal_dic = {s.name:s for s in r.signals.values() if s.name in signal_list}
data_dic = {}
if len(signal_dic) == len(signal_list):
    # Find the latest timestamp at sample_id=0 among signals
    timestamp_to_sync = max([r.sample_id_to_timestamp(signal_dic[s].signal_id, 0) for s in signal_list])
    # Collect data aligned time with timestamp_to_sync
    for signal in signal_list:
        sample_id = r.timestamp_to_sample_id(signal_dic[signal].signal_id, timestamp_to_sync)
        data = r.fsr_statistics(signal_dic[signal].signal_id, sample_id, 1, signal_dic[signal].length-sample_id)
        data_dic.update({signal:data})
        
length_original = [{name : s.length} for name, s in signal_dic.items()]
length_aligned  = [{name : len(d)} for name, d in data_dic.items()]
print(f'Orignal length {length_original}')
print(f'Aligned length {length_aligned}')

This code outputs:

Orignal length [{'power': 300000}, {'gpi[0]': 300000}, {'gpi[1]': 300000}]
Aligned length [{'power': 297178}, {'gpi[0]': 299597}, {'gpi[1]': 300000}]

The output indicates capture has been started in order of ‘power’, gpi[0], gpi[1].

Correct. The first sample of each signal has sample_id == 0 and the last sample_id is length - 1.

Your code looks good to me, but I think you probably want fsr (raw samples) rather than fsr_statistics (summarized statistics over increment intervals) if you are using increment 1.

You may also only want the intersection so that you are analyzing the same region across each signal. Here is untested code showing what I mean:

...
t_start = max([r.sample_id_to_timestamp(signal_dic[s].signal_id, 0) for s in signal_list])
t_end = min([r.sample_id_to_timestamp(signal_dic[s].signal_id, r.signal[s].length) for s in signal_list])
for signal in signal_dic.values():
    signal_id = signal.signal_id
    s_start = r.timestamp_to_sample_id(signal_id, t_start)  # inclusive
    s_end = r.timestamp_to_sample_id(signal_id, t_end)  # exclusive
    s_length = s_end - s_start
    data_dict[signal.name] = r.fsr(signal_id, s_start, s_length)
...

I actually stripped data afterwards. But your suggestion is more straightforward. Thank you.

Any difference between fsr and fsr_statistics when increment=1?

Other than the amount of computation and data structure size, no. The fsr value should be the same as the fsr_statistics mean value when increment is 1.

1 Like

The fsr value should be the same as the fsr_statistics mean value when increment is 1.

gpi0/gpi1 value looks different. fsr_statistics has 0 or 1 while fsr has 0 or 255.
Is this expected?

data_stat = r.fsr_statistics(signal_dic[signal].signal_id, s_start, 1, s_length)
data_raw  = r.fsr(signal_dic[signal].signal_id, s_start, s_length)
if signal == 'gpi[0]':
    print(f'fsr_statistics:\n{data_stat}')
    print(f'fsr:\n{data_raw}')

Output:

fsr_statistics:
[[0. 0. 0. 0.]
 [0. 0. 0. 0.]
 [0. 0. 0. 0.]
 ...
 [1. 0. 1. 1.]
 [1. 0. 1. 1.]
 [1. 0. 1. 1.]]
fsr:
[  0   0   0 ... 255 255 255]

Ah, yes. fsr_statistics returns 32-bit floating point numbers. fsr returns packed data. For current, voltage, and power, this makes no difference. For 1-bit gpi signals and 4-bit current_range signals, the data remains packed. Here is the code to unpack the data y:

if data_type == 'f32':
    pass
elif data_type == 'u1':
    y = np.unpackbits(y, bitorder='little')[:len(x)]
elif data_type == 'u4':
    d = np.empty(len(y) * 2, dtype=np.uint8)
    d[0::2] = np.bitwise_and(y, 0x0f)
    d[1::2] = np.bitwise_and(np.right_shift(y, 4), 0x0f)
    y = d[:len(x)]

I noticed s_length is not same in signals.
In a test case, s_length in power has larger 2 than gpi0, gpi1.
Is it expected?

You said "Each signal is streamed separately and independently." So a timestamp in a signal doesn’t match exactly with other signals, which causes difference in s_length, I think.

“s_length” is from this test code.

...
t_start = max([r.sample_id_to_timestamp(signal_dic[s].signal_id, 0) for s in signal_list])
t_end = min([r.sample_id_to_timestamp(signal_dic[s].signal_id, r.signal[s].length) for s in signal_list])
for signal in signal_dic.values():
    signal_id = signal.signal_id
    s_start = r.timestamp_to_sample_id(signal_id, t_start)  # inclusive
    s_end = r.timestamp_to_sample_id(signal_id, t_end)  # exclusive
    s_length = s_end - s_start
    data_dict[signal.name] = r.fsr(signal_id, s_start, s_length)
...

Using a JS110, I captured and inspected:

pip install -U pyjls pyjoulescope_driver
python -m pyjoulescope_driver record --set "s/i/lsb_src=gpi0" --set "s/v/lsb_src=gpi1" --set "s/extio/voltage=1.8V" --duration 3 --frequency 100000 --signals power,gpi[0],gpi[1] test.jls
python -m pyjls info --verbose .\test.jls

All signals have a length of 295000 samples. Power has sample_id_offset 0 but gpi[0] and gpi[1] have sample_id_offset 1613.

I then used this code to analyze the signals further:

from pyjls import Reader
import sys

if len(sys.argv) <= 1:
    print('usage: python jls_dev.py {jls_path}')
    sys.exit(1)

r = Reader(sys.argv[1])
signal_list = ['power', 'gpi[0]', 'gpi[1]']
signal_dic = {s.name:s for s in r.signals.values() if s.name in signal_list}
data_dic = {}
if len(signal_dic) == len(signal_list):
    t_start = max([r.sample_id_to_timestamp(s.signal_id, 0) for s in signal_dic.values()])
    t_end = min([r.sample_id_to_timestamp(s.signal_id, s.length) for s in signal_dic.values()])
    for signal in signal_dic.values():
        signal_id = signal.signal_id
        s_start = r.timestamp_to_sample_id(signal_id, t_start)  # inclusive
        s_end = r.timestamp_to_sample_id(signal_id, t_end)  # exclusive
        s_length = s_end - s_start
        print(f'{signal.name}: s_start={s_start}, s_end={s_end}, s_length={s_length}')
        data_dic[signal.name] = r.fsr(signal_id, s_start, s_length)
sys.exit(0)

Saving this as jls_dev.py and running python jls_dev.py .\test.jls outputs:

PS C:\tmp> python jls_dev.py .\test.jls
power: s_start=1613, s_end=295000, s_length=293387
gpi[0]: s_start=1, s_end=293387, s_length=293386
gpi[1]: s_start=1, s_end=293387, s_length=293386
PS C:\tmp>

I would expect gpi[0] and gpi[1] to have s_start=0, which explains the off-by-one error. The question is why? Could be writer or reader. I modified pyjls’s info command to add a --utc option.

Running python -m pyjls info --utc test.jls now shows:

Sources:
    0: global_annotation_source
    1: JS110-000494
Signals:
    0: global_annotation_signal
    1: power
       0, 180300557308144643
       290000, 180300560421995933
    2: gpi[0]
       290000, 180300560439315388
    3: gpi[1]
       290000, 180300560439315388
User Data:

So, the power signal has an entry for sample_id 0, but the gpi signals do not. With only one UTC time entry, the code uses the provided sample rate to convert. Since the JS110 has only 30 ppm clock accuracy and we are running at 100 kHz, we would expect about ±3 samples error per second. The fact we are only seeing 1 is pretty good.

The recorder needs to add an initial UTC entry for these other signals to fix this. Upon closer inspection, the recorder always added a UTC entry at sample 0, which was -1613. The existing UTC reader code and the new info code started from 0. They should seek to a little earlier.
However, the recorder should also write an initial UTC entry with the initial sample_id.

With both of these fixes, recapturing a JLS file and running python jls_dev.py .\test.jls now shows:

power: s_start=1613, s_end=295000, s_length=293387
gpi[0]: s_start=0, s_end=293387, s_length=293387
gpi[1]: s_start=0, s_end=293387, s_length=293387

I will make another release later today after I track down another (related?) issue with JLS export from the Joulescope UI 1.0.x.

1 Like

This should be fixed in the newly release pyjls 0.6.2 and pyjoulescope_driver 1.3.7. You should be able to update:

python3 -m pip install -U pyjls pyjoulescope_driver

Does this fix the issue?

Yes, it does. Thank you!

1 Like