Questions on Kickstarter Preview

From “Stephan Electronics”
Originally posted to Kickstarter preview comments


Very nice campaign!

Few questions:

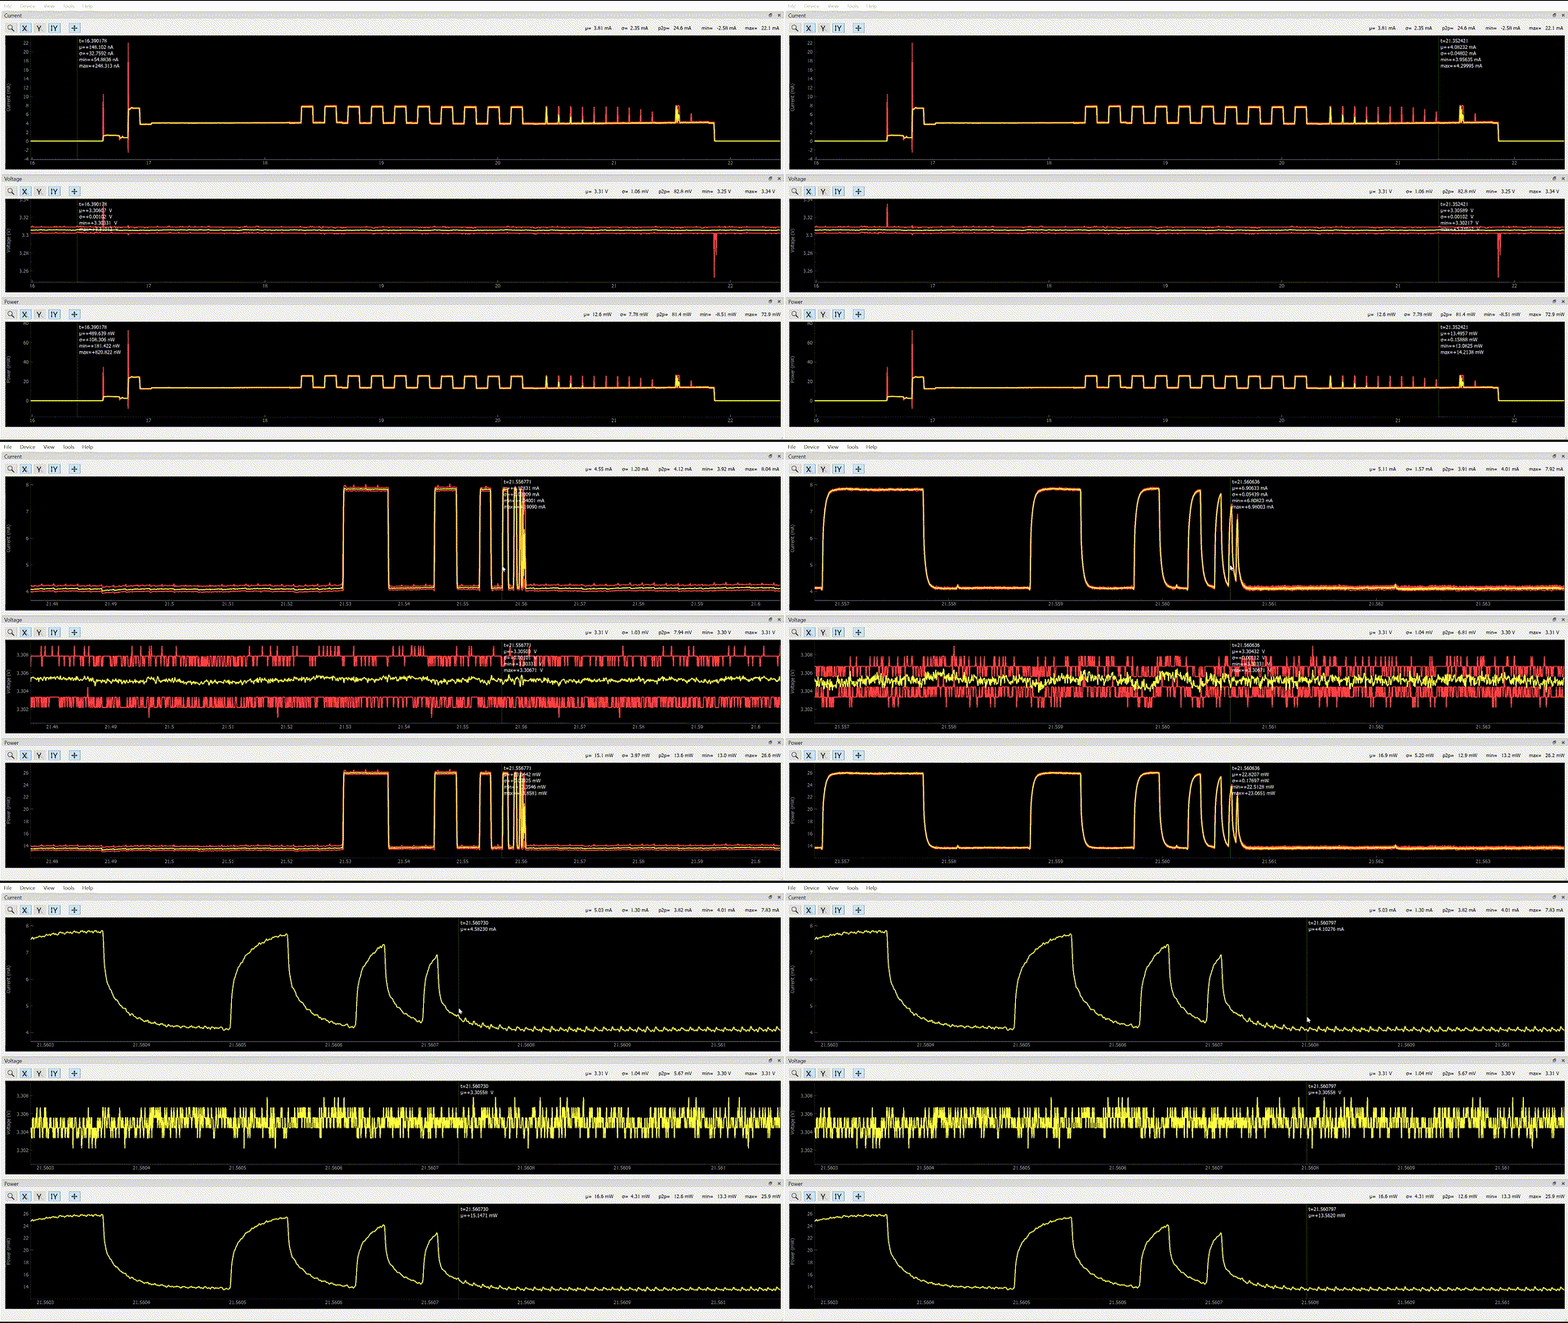
  1. in your GIF, could you explain why the current consumption curves are in the shape of RC charge/discharge curves? this is atypical if you’re measuring an MCU current consumption.
  2. what’s the maximum voltage drop for different ranges (switching logic)?
  3. why is the 18uA bandwidth only 15kHz? Could you expand on “Test current measurement bandwidth by varying the effective load impedance. Due to load capacitance, varying the source voltage is not a valid method of testing current bandwidth.”
  4. I’m guessing you didn’t specify output current leakage due to auto-zeroing?

Very nice work!

On (1):

Every circuit has capacitance and resistance. In the case of the GIFs on the Kickstarter page, they were collected with an Arduino Pro Mini target running at 3.3V. The current varies between roughly 4 mA and 8 mA.

From the Sparkfun Arduino Pro Mini Schematic, we see that the target device has 10 μF capacitance. Note that I desoldered the “Power Isolation Jumper”.

Joulescope will be in the 18 mA range, which has a 1.11 Ω shunt resistor. We can approximate the response using that RC time constant:

τ = R * C = 1.11 Ω * 10e-6 F = 11 μs

Joulescope samples 2 million times per second. Approximating from the most zoomed in GIF, this looks about right.

Let’s double-check on real hardware! Joulescope is a shunt ammeter, and the measured currents are really the voltage across the shunt resistor. I can use the current reading just like a voltage for computing RC time constants. I measure 7.25 mA @ time 28.665306 falling to 3.65 mA. The 63.2% change (corresponding to the RC time constant) happens at 4.97 mA. I measure 4.977 mA at 28.665318, a time difference of 12 μs.

τ = R * C
C = τ / R = 12e-6 / 1.11 = 10.8 μF

This matches the expected 10 μF very nicely!

1 Like

On (2):

Joulescope attempts to maintain between 0 mV and 20 mV across the shunt resistor at all times and for all current ranges (shunt resistor values). The smallest shunt resistor is 0.01 Ω, so Joulescope can keep this voltage all the way up to 2A. The Burden Voltage (IN+ to OUT+) specification is 25 mV typical @ 1 A. This value includes to 10 mV shunt resistor and the additional voltage drop due to the banana jack connector resistance, front panel connector resistance, MOSFET resistance (used for selecting the shunt resistor) and trace resistance. For any range other than 10A & 2A, the other resistance adds negligible voltage drop, so 20 mV is the max.

On (3):

Physics of the system, not Joulescope! Well, Joulescope does contribute some parasitic capacitance (which we have worked hard to keep low!) that also affects the response. The Joulescope measurement front-end is still the same with >250 kHz bandwidth.

Let’s first talk about testing load by varying the supply voltage.

If you have a target board, it will have resistance, capacitance and inductance which contribute to the total impedance. In order to test Joulescope’s current measurement bandwidth by varying the supply voltage, we need the target to have a constant impedance over frequency. However, this is very difficult to do. The equation for the impedance magnitude of a capacitor is:

1 / (2 * pi * f * C)

If we are trying to draw 1 μA at 1 V to test Joulescope, then the total load impedance is 1 MΩ. Anything introduced by capacitance on this order results in error due to measurement. Let’s see what that means at 15 kHz:

1 MΩ = 1 / (2 * pi * 15000 * C)
C = 11 pF

Wow! That’s not much. To give you perspective, two 18 gauge wires 30 cm in length separated by 2 cm have a capacitance of approximately 30 pF. This reduced impedance will result in increased current that invalidates the measurement bandwidth. When measuring by using varying source voltage, you see that current increases with frequency! Expected from physics, but not what we want to measure!

Now let’s look at what happens when we measure by varying the load impedance.

We have the same problem with capacitance, but in reverse. We are still trying to keep a high impedance load, say around 1 MΩ with some amplitude, say ±10 kΩ. But we now have the capacitance looking back at the 1111 Ω shunt resistor in Joulescope. My custom test load also requires some capacitance to remain stable over frequency. I need to do better at documenting my actual test setup. I can probably revisit the test setup, reduce the load capacitance, and be able to specify better Joulescope performance. However, I would rather the specification reflect real-world measured performance!

In general, creating a system with high bandwidth and high impedance anywhere in the system is very difficult. This reason is one of several reasons of why it took me 17 Joulescope prototypes to get Joulescope’s performance to where it is now!

When using Joulescope in practice, this bandwidth is not an issue for microcontroller power measurement accuracy. When the target starts drawing more current, it’s impedance reduces and the voltage across the Joulescope’s shunt resistor will increase. As soon as the target board drops 20 mV from the supply voltage, Joulescope’s shunt resistor will see 20 mV. Joulescope detects this very quickly (1 μs) and switches to the appropriate higher current range (lower shunt resistor).

I know that this is not a completely thorough explanation. I have very detailed LTSpice simulations of Joulescope, but they are too detailed to help explain! I need to put together some simplified simulations.

The key point is that this bandwidth reduction is common to all shunt ammeters! As the shunt value increases, the measurement bandwidth decreases. Please reply if you want more detail sooner rather than later!
1 Like

On (4):

I didn’t specify OUT+ to OUT- leakage because I tend not to think of Joulescope this way. IN+ to IN- is really all that matters, and it includes all leakage current due to inserting Joulescope to make measurements. I should clarify that the IN+ to IN- leakage was measured with Joulescope operating and the shunt resistor active. The IN+ to IN- leakage spec therefore includes all leakage due to Joulescope, both before and after the shunt resistor. Also note that manually selecting the 10A range (the 0.01 Ω shunt resistor) has no effect on leakage current.

To expand on (1), here is the gif showing current, voltage and power at the same time.
software_zoom_2

Note that the power curve shape follows the current curve shape since the voltage is nearly constant. The “smoothed” RC edges represent the system bandwidth due to the load capacitor, but in no way affect the energy calculation. The capacitor stores energy, so the instantaneous power measured by Joulescope is not exactly the instantaneous power being consumed by the ATmega328. It’s the instantaneous power being consumed by the board!

See this post which describes the three traces in each scope view.

Pardon me if this reply isn’t the right way to add to “Kickstarter Preview”.

Is there .csv support in the March software? I can’t find any mention in conjunction with searching for “file” in the user guide and looking through all the menus and preferences.

Hi @Pete,

The Joulescope UI version 0.2.7 (latest version) only supports recording to the custom (but open source) “jls” file format. I will be adding the ability to select a region and then export the selected region to the file type of your choice. I do not currently plan on supporting other file formats for saving full-rate streaming data due to the 32 MB/s calibrate data rate. I do plan on adding downsampling, including heavy downsampling for more logging-style applications. I will likely add support for other formats for downsampled data including CSV.

In the meantime, you can use the “joulescope” command line tool to convert “jls” data into either “npy” or “csv” format. Install Python to your computer, then:

pip install joulescope

You can then run this command:

python -m joulescope <src_path.jls> --export <tgt_path.csv> --start <start_index> --stop <stop_index>

Slightly more help is available:

python -m joulescope --help

We have a list of “future features” on GitHub. Many will be completed before the Kickstarter shipment.

I want to make sure that we implement what you want. What do you currently have in mind for CSV? What sample rate and duration do anticipate storing to CSV?