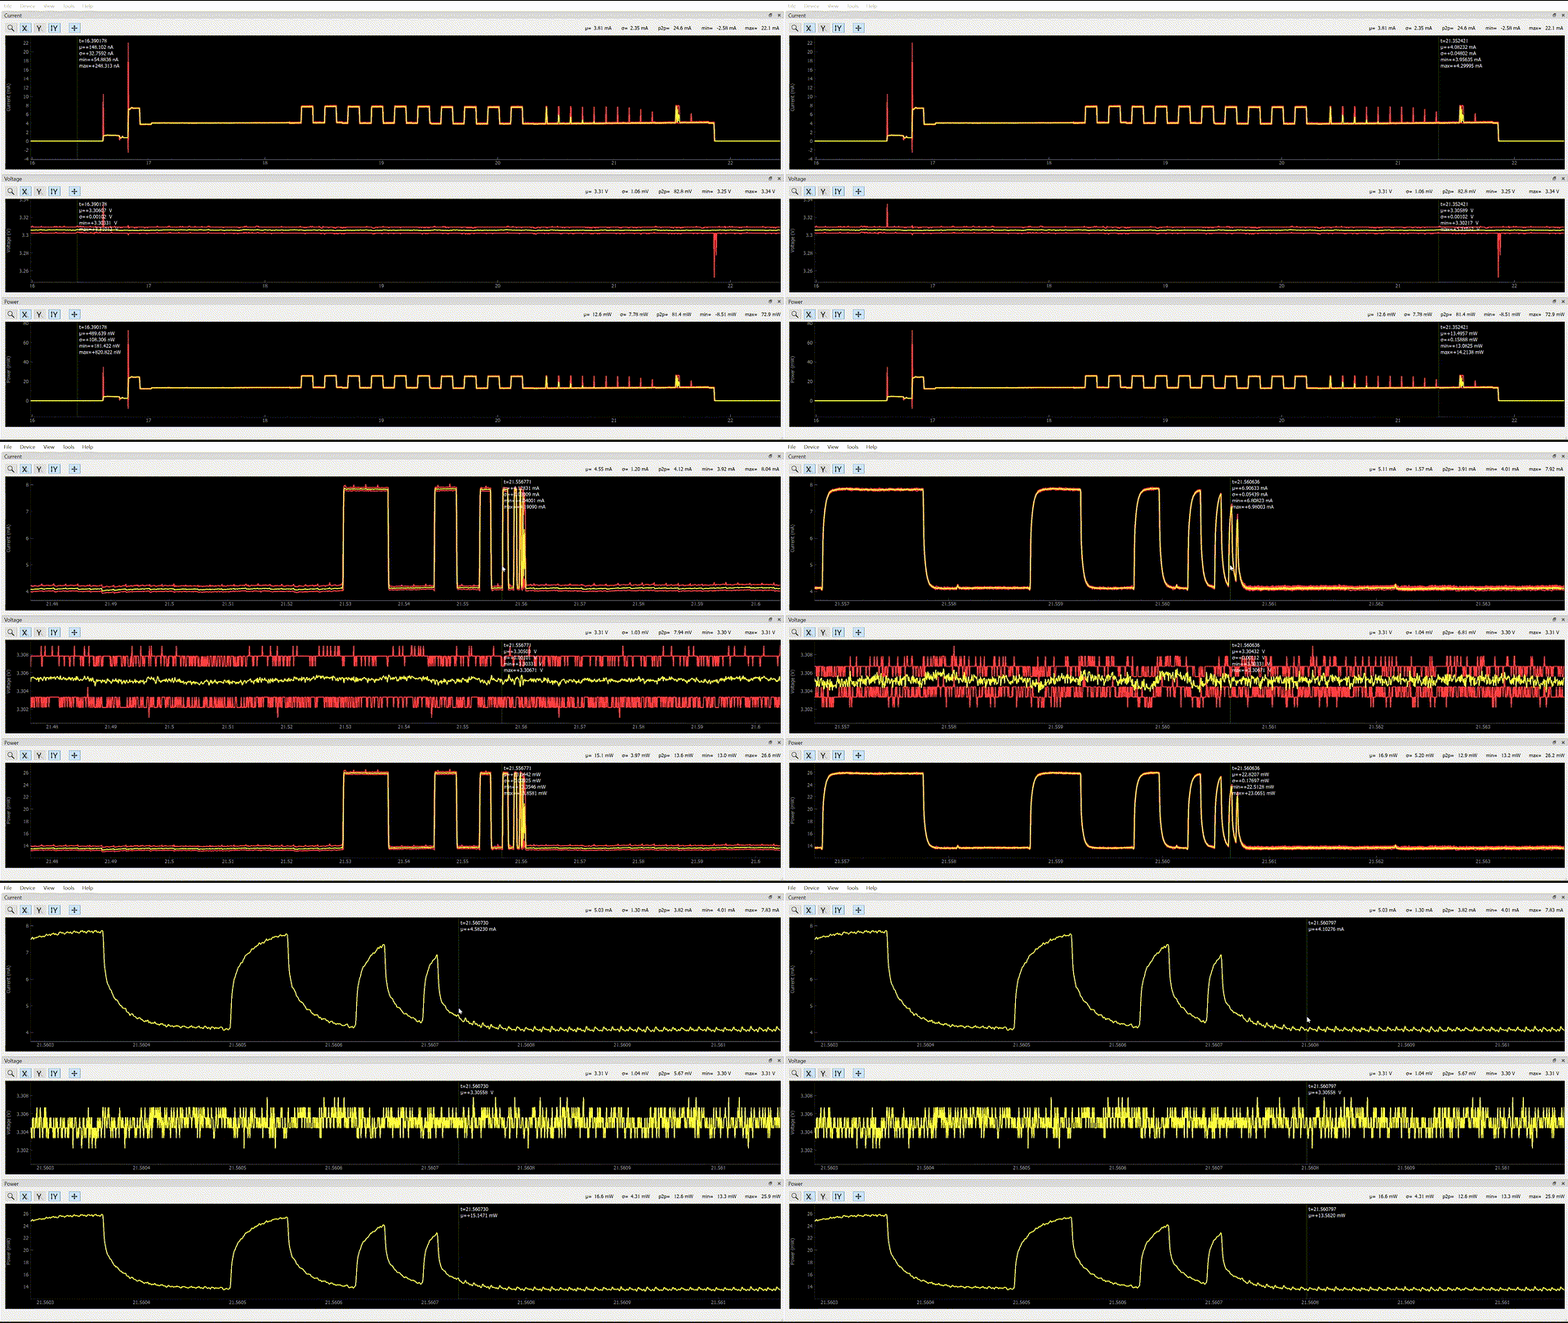
To expand on (1), here is the gif showing current, voltage and power at the same time.

Note that the power curve shape follows the current curve shape since the voltage is nearly constant. The “smoothed” RC edges represent the system bandwidth due to the load capacitor, but in no way affect the energy calculation. The capacitor stores energy, so the instantaneous power measured by Joulescope is not exactly the instantaneous power being consumed by the ATmega328. It’s the instantaneous power being consumed by the board!
See this post which describes the three traces in each scope view.