This may be identical to the issue I reported in the Crash on Histogram request topic, but I’m creating an new issue specific to this problem, because it is causing me to lose hours worth of data, and I am on a tight schedule to collect these data and produce reports.
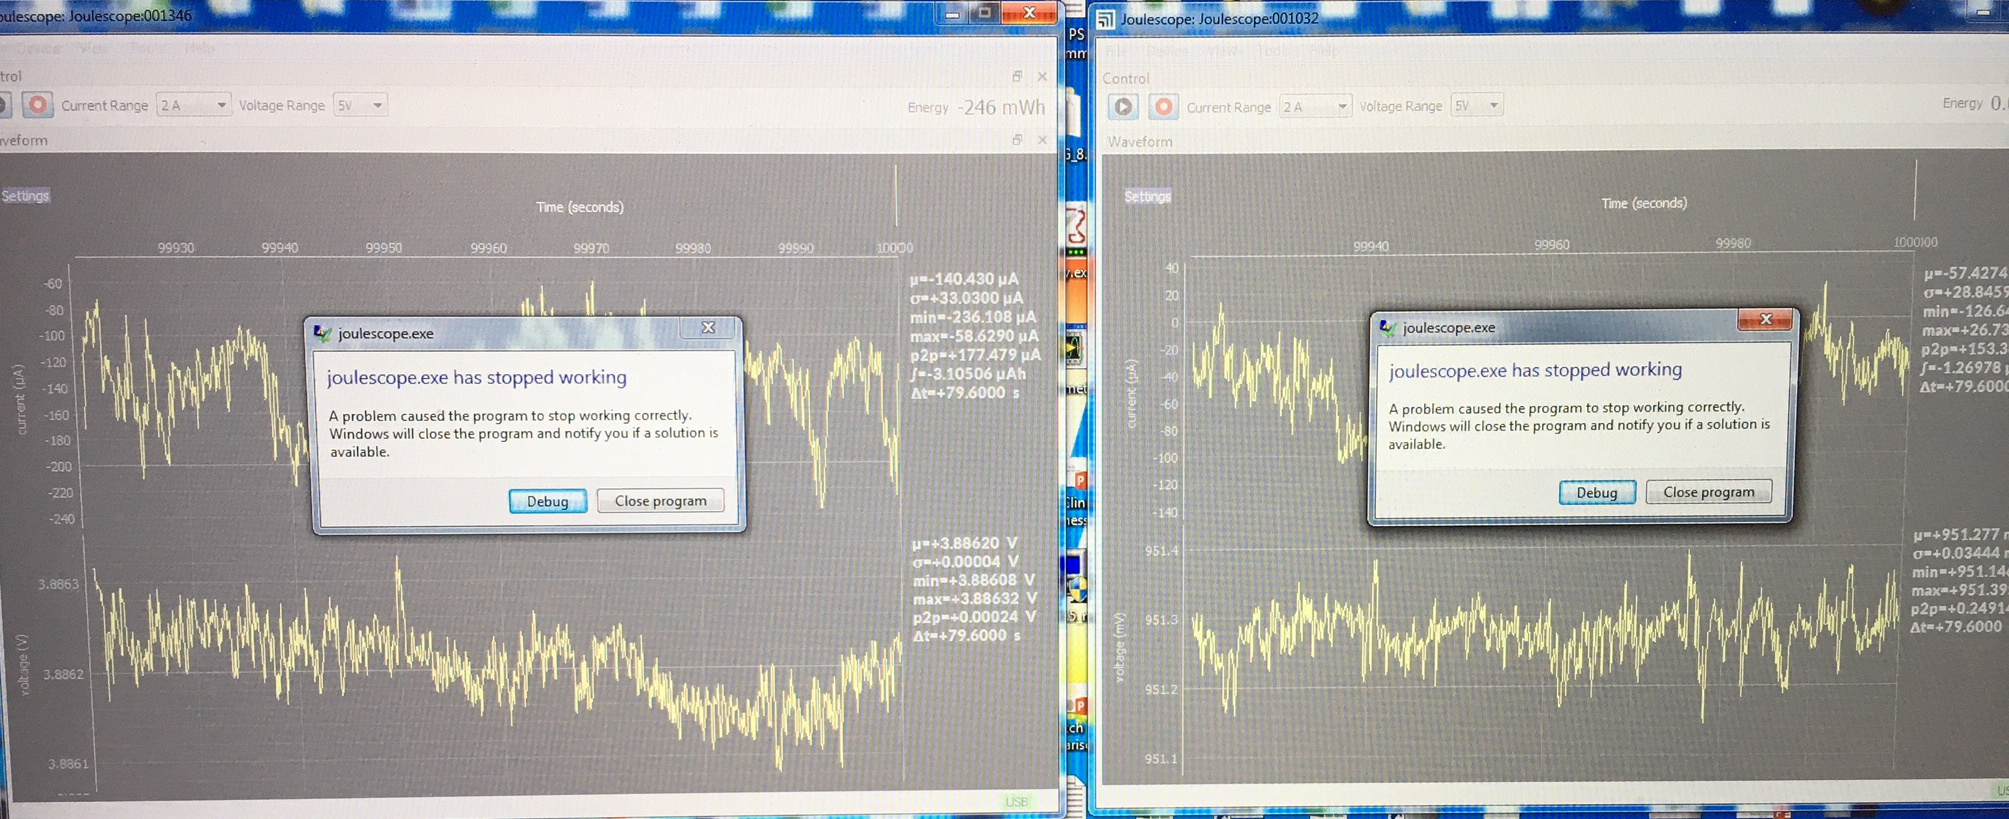
I started two instances of Joulescope UI last night before leaving work to perform a charging test that takes 3-4 hours to complete. Upon arriving this morning, this was on my screen.
I had to go into Task Manager and end both processes after exiting the dialog. I went to look at the log files, which both appeared to have a lot of data in them due to file size, but when I opened them I got ‘Could not initialize device’ at the bottom of the screen and no data was displayed. Another night of testing down the drain. This is not an infrequent occurrence. In fact, I started up one instance of Joulescope before I started entering this post. It has already crashed again, and this time I was not even logging any data, just capturing.
I now have to discharge the battery in my DUT and recharge the battery in my charger, which takes a few hours, before I can run another test. Please escalate this issue - I consider it critical. I have purchased three of these units, two recently (one was used for the very first time to run this test). They were purchased to acquire data logs to test a wireless charging system (both battery being charged in DUT and battery used to provide inductive power source). They are not of much use to me if I cannot use them for their intended purpose.
Thank you again for the log files, and I apologize that your Joulescope software is misbehaving. We are working on this issue as our top priority. At this point, we have identified that upgrading PySide2 from 5.13.x to 5.14.x caused these crashes to start happening on some machines. PySide2 is the graphics library binding for Qt that the Joulescope UI uses.
We have been able to make changes that make this problem appear more frequently, which greatly assists with our efforts to fix this problem. We are still working to identify the underlying root cause of this issue in either PySide2 or our software. The following issues are all related:
We just released Joulescope UI 0.8.11. You can download this new version from the download page, and here is the direct Win10 x64 link.
I recommend that you download and try out this new release to see that it solves the issues you observe. This release has already passed our basic acceptance tests on Windows, macOS, and Linux. We are currently running long-term testing, which is looking good so far. Although this release is currently tagged “alpha”, we plan to make publish it as “stable” once testing completes successfully.
If you run into issues with this new release, please post here!
And again…
I’m not able to run more than about 10 minutes before something crashes. Could the problem be related to running two instances of joulescope? I opened up the log file to see why the one instance crashed, and the other instance crashed almost immediately afterwards. Is there maybe a problem caused by writing to the log file? I don’t think it has to do with data recording, because I am also crashing without recording data, although in this case I was recording data in both instances.
We have been running the 0.8.11 Joulescope UI software on four computers for the entire weekend without a single crash. I started a new test with two Joulescope connected to a single Win 10x64 machine to see if I can duplicate the issue. The test has no issues so far. I think that we need to isolate what is causing problems with your setup.
Do you see any crashes with a single Joulescope?
If you use a Win10x64 machine (your logs show Win 7x64), do the crashes go away?
Could you post your config file for the Win7x64 machine? For you, it will be located at:
C:\Users\khoneyager\AppData\Local\joulescope\config\joulescope_config.json
The tests I am trying to conduct require two Joulescopes. I’ll see if I can set up my third one on another machine. I will also see if I can scrounge up a Win10 machine. The two machines on which I’m conducting tests are both Win7Pro. I will post the config in the morning.
I can’t find where the device settings are logged in the log files. I think it is important that you run two Joulescopes using my device settings. I will confirm in the morning, but IIRC they are 2A range, 5V, 10 hour buffer, 10Hz sample rate, reduction of 1Hz.
My device settings are: 2A, 5V, 5 hour buffer, 10Hz sample rate, 1Hz reduction. My config file is attached here as zip, because json was not an authorized extension:
The config settings are not currently included in the log file, something I need to fix. It hasn’t been a concern until now. For what its worth, I successfully ran 2 Joulescopes on a Win10x64 laptop overnight with autoranging, 15V, 10 kHz, 2 Hz reduction. The CPU utilization was about 33% and RAM utilization was under 50%. I will try running another test with the configuration file you provided.
In related news, my Win10x64 laptop with 2 Joulescopes and your config is still happily capturing data. 31% CPU utilization and 47% memory utilization.
Test completed and both Joulescopes are still running (~18 hours) on Win10 machine. However, I have also had a single Joulescope run over an entire weekend on a Win7 machine, and have had two Joulescopes complete the test (~4hrs) on Win7 machines on multiple occasions, so it’s hard to draw any definitive conclusions about OS’s at this point.
Understood. It looks like one of the two instances crashed overnight on the Win10x64 laptop, but Windows Update was also trying to reboot, so can’t make anything definitive of it. I just restarted the two instances and disabled networking this time.
@wired Quick update: my Win10x64 laptop is still running both Joulescope UI 0.8.11 instances and is still recording from both instances. This laptop is using the Joulescope UI configurations that you provided. Good that its working, bad that it is not failing like you have observed…
I’m still doing well with both scopes on the Win10 system. Capture has been running almost continuously since the 14th. I turned on data lgging this morning for both units and will check them on Monday.
Well, one of the two Joulescope UI instances crashed on my Win 10 x64 laptop over the weekend while running 0.8.11 with your configuration: joulescope_20200415_120717_1112.log (327.7 KB)