Hey all,
I’ve been hitting an issue lately when taking long running captures in the joulescope UI. Basically, it seems like the UI locking up after I end the capture. It shows up in windows as “Not responding”, but in the background the JLS file is continuously growing. If I run a test overnight, it can take 30 to 45 minutes for the UI to become responsive again.
I assume it is post-processing data and writing it to the JLS? I think this used to behave better, I don’t remember seeing this issue on earlier versions of joulescope UI. Any advice on speeding up the end of the capture?
Looking in process explorer, joulescope.exe is uing very little CPU (1-2%), but has a LOT of memory allocated to it. (3-5GB).
Thanks!
Joulescope: JS110
Joulescope UI version: 0.10.13
Driver version: 1.0.16
Windows 11
Settings:
Sampling rate: 500Hz
Reduction rate: 100Hz
Buffer: 30s
1 Like
Hi @CameronJohnson and welcome to the Joulescope forum! Nothing about the JLS file format should require even a second to close, so you are definitely seeing something unexpected. With a 500 Hz sampling rate, your JLS files should be relatively small, too.
I just configured Joulescope UI 0.10.13 with a JS110 set to the same 500 Hz sample rate, 30s buffer duration, 100 Hz reduction rate, and Task Manager shows 122.5 MB memory usage. When I start recording, that jumps to 211 MB. However, memory usage does appear to grow, but we need more testing to be sure. If I try recording at 2 MHz, memory usage appears constant at ~1080 MB.
I have a few questions:
- When you do wait for the 30 - 45 minutes for the UI to become responsive again after stopping the capture, does the memory usage also return to about 122 MB?
- Can you still successfully open these captured JLS files?
- Can you share the log file (Help → View logs…) from one of these captures? Feel free to email it to support at joulescope.com and reference this forum post.
I just ran a new test to validate some of the things you’ve mentioned, as well as try some other stuff.
Previously, I had been running joulescope ui from the installer on the website. I just tried it using the python3.10 pip package and had the same outcome. So installation method doesn’t seem super involved.
The JLS files are valid and can be opened. They don’t even take that long to load into the UI, all things considered.
In this test, I ran the program through the python interpreter (e.g. using python -m joulescope_ui).
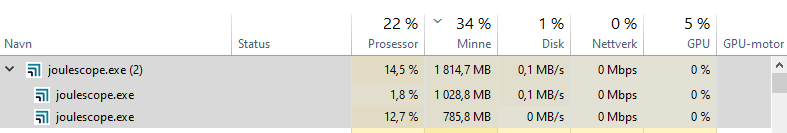
Using the same settings as before, I ran a capture for around 15 minutes. Right before I stopped the recording, the process looked like this (so many more than 122MB):
After hitting save, the process locked up for 4 minutes 17 seconds. During that time, the memory used by the process continued to grow. Here is what it looked like 2 minutes after hitting save:
When the UI was responsive again, it looked like this (one fewer processes?):
The memory usage continued to go down from there.
Attached are the logs I think you are asking for.
joulescope_20230221_190548_15440.log (28.8 KB)
joulescope_20230221_173947_13760.log (177.2 KB)
Thanks for the additional testing and info. That is definitely different from what I am seeing. Using the Joulescope UI 0.10.13 and a JS110, I just recorded for about an hour (3300 seconds) at sample_rate 500 Hz. The resulting JLS file is 24 MB. The memory utilization of the first process was about 110 MB. The second recording process fluctuated from 120 MB to 400 MB, but chunked down, presumably when python garbage collection ran. I saw no holdup when stopping the recording. The Joulescope UI continued to work normally.
So, now we just need to figure out what is different on your computer. The log file joulescope_20230221_190548_15440.log shows that the capture proceeded without error, so it’s running just fine.
It looks like you are recording to your F: drive.
-
What is this media? SSD? HDD? Network drive?
-
If you try recording to your fastest drive, like the C: drive, does anything change?
I’ve been using the F: drive because it’s a large HDD. When I take captures with a higher sampling rate I need the extra space.
I don’t see any difference in behavior when saving to my C:\ SSD.
Hi @CameronJohnson - Thanks. The HDD should work fine.
At this point, I am not sure what is happening with the Joulescope UI saving to JLS on your computer. We have some major Joulescope UI changes coming very soon, which means it does not make sense to spend a lot of time troubleshooting Joulescope UI 0.10.13.
However, I would be very interested to know if you see the same behavior running the capture from the command line. Running from the command line may also be a good workaround.
Since you already installed python, this should be pretty easy. You can use capture.py from pyjoulescope_examples.
For (2), I think your command line will be something like:
python capture.py --frequency 500 out.jls
Does this work better?
That seems promising, but I can’t get it to work with any sample rates lower than 10MHz, resulting in massive files.
python .\capture.py --frequency 500 C:\redacted\test3.jls
Capturing data from JS110-002207: type CTRL-C to stop
<joulescope.data_recorder.DataRecorder object at 0x000001E9EC353E50> stream_notify() exception
Traceback (most recent call last):
  File "C:\redacted\joulescope\lib\site-packages\joulescope\v1\device.py", line 424, in _stream_process_call
    rv |= bool(fn(*args, **kwargs))
  File "C:\redacted\joulescope\lib\site-packages\joulescope\data_recorder.py", line 205, in stream_notify
    raise ValueError('stream_buffer length too small.  %s > %s' %
ValueError: stream_buffer length too small.  400000 > 15000
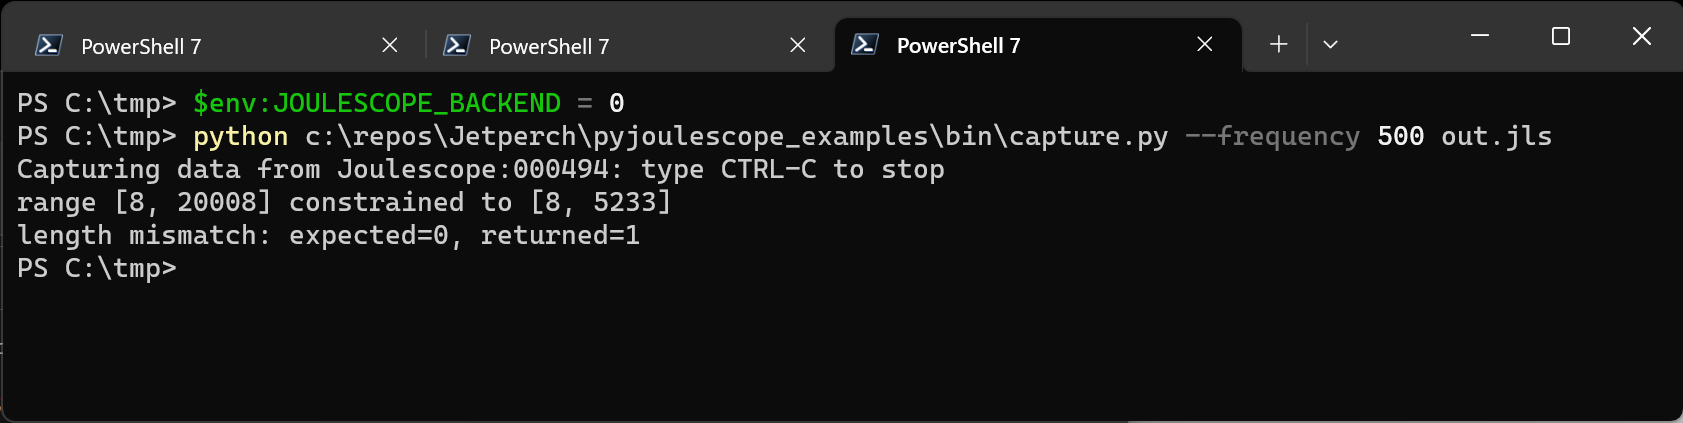
Ok, looks like the v1 backend does not automatically increase the stream buffer size for very low sampling rates. I have another thing to try; use the v0 backend. In PowerShell:
$env:JOULESCOPE_BACKEND = 0
python .\capture.py --frequency 500 C:\redacted\test3.jls
I verified that I can open and view the captured file using Joulescope UI 0.10.13.
Or in the old command shell:
set JOULESCOPE_BACKEND=0
python .\capture.py --frequency 500 C:\redacted\test3.jls
Hi @mliberty ,
Sorry to hijack this thread, but i’m also experiencing this exact problem when trying to capture data at 200Hz. When capturing for 30min-1hour and stopping the capture, the UI stops responding but the RAM keeps growing for another hour or so (1.8GB).
When the UI finally became responsive again, the RAM settled at 462MB, and the filesize at 10.4MB.
At first i thought maybe it was because the file logged on a cloud synced folder. But i tried directly on my C: drive (SSD) without any luck.
I am not able to run the capture.py script from the command line… I get the same error as @CameronJohnson .
C:\Joulescope\pyjoulescope_examples-main\bin>python capture.py --frequency 500 out.jls
Capturing data from JS220-000121: type CTRL-C to stop
<joulescope.data_recorder.DataRecorder object at 0x000001E99E8C7EB0> stream_notify() exception
Traceback (most recent call last):
  File "C:\Users\Thomas\AppData\Local\Programs\Python\Python310\lib\site-packages\joulescope\v1\device.py", line 424, in _stream_process_call
    rv |= bool(fn(*args, **kwargs))
  File "C:\Users\Thomas\AppData\Local\Programs\Python\Python310\lib\site-packages\joulescope\data_recorder.py", line 205, in stream_notify
    raise ValueError('stream_buffer length too small.  %s > %s' %
ValueError: stream_buffer length too small.  400000 > 15000
stream in ignore on inactive port 21
stream in ignore on inactive port 22
stream in ignore on inactive port 21
stream in ignore on inactive port 22
stream in ignore on inactive port 25
stream in ignore on inactive port 20
stream in ignore on inactive port 21
stream in ignore on inactive port 22
stream in ignore on inactive port 21
stream in ignore on inactive port 22
stream in ignore on inactive port 21
stream in ignore on inactive port 22
stream in ignore on inactive port 21
stream in ignore on inactive port 22
stream in ignore on inactive port 24
stream in ignore on inactive port 20
stream in ignore on inactive port 21
Joulescope: JS220
Joulescope UI version: 0.10.13
Driver version: 1.0.15
Windows 10
Settings:
Sampling rate: 200Hz
Reduction rate: 2Hz
Buffer: 30s
Not sure what to do now as both UI and script isn’t working properly.
Will send log files on mail.
EDIT: Running the v0 backend in PowerShell just keeps giving me error “no device found”. Maybe this isn’t supported for the new JS220?
Hi @TR-elwatch, and welcome to the Joulescope forum! Thanks for the additional information and the log file. The log file is very interesting and shows a consistent sample id issue, which we will investigate.
The strange part is that I had a 500 Hz sample capture using Joulescope UI 0.10.13 on Windows 11 x64 running for over a week until I shut it down yesterday. Fortuntately, I was able to duplicate a failure on 500 Hz captures yesterday on multiple platforms (Win11 x64, macOS x64, macOS arm64), so we are making progress.
We are working on this issue. Unfortunately, we do not have a great workaround yet for recording at low sampling rates other than recording at a higher sampling rate. I believe that 10 kHz should work, but you may find that a lower sampling rate will still work.
I did some further testing on other sampling frequencies.
- 10 kHz works fine. Saving data to disk every minute or so - steady 120MB ram.
- 5 kHz also works fine. Saving data to disk every other minute or so - 150MB ram before saving
- 2 kHz starts to see issues. Saving to disk every 4 minutes. 250MB ram before saving (12% CPU)
- 1 kHz freezes the UI for one saving cycle. Saving to disk every 10 minutes. 390MB ram before saving (also 12% CPU)
1 Like
Sorry I haven’t responded in a bit, I tried using the the JOULESCOPE_BACKEND=0 trick and with that change the capture.py script is sufficient for my needs.
Thanks!
2 Likes
@mliberty What is the expected release date for the new Joulescope UI update? 
Just ordered my second Joulescope, so can’t wait to do some long-term testing of my batteries 
@TR-elwatch Great to hear! The first alpha for Joulescope UI 1.0.0 really needs to be this week. We are working on it!
1 Like
Hi @CameronJohnson - We finally have the first stable Joulescope UI 1.0 release, which should definitely fix this issue. Please post again if you still run into this issue!