I left the LabVIEW running while typing up the previous post and NOW there is activity in the command replys.
However, its just freewheeling and not exiting this command reply section.
I left the LabVIEW running while typing up the previous post and NOW there is activity in the command replys.
However, its just freewheeling and not exiting this command reply section.
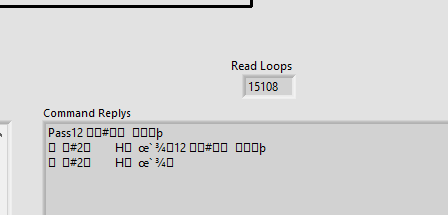
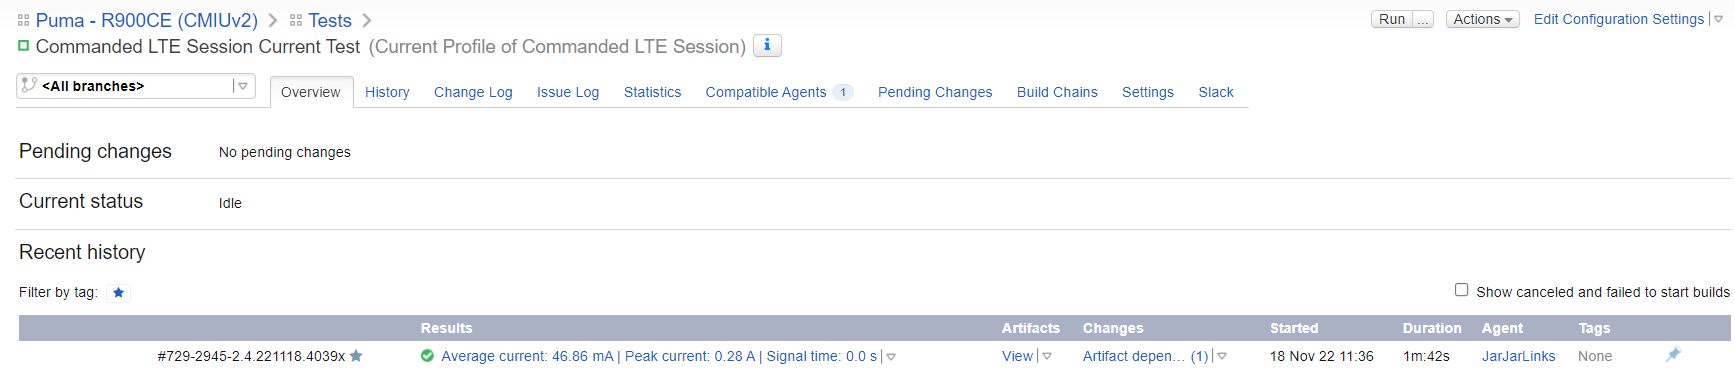
It finally exited on its own. It didn’t capture the correct signal, but there is some life in there:
Ok, good to know that this fails at the command line and not just in CI. So with the new 1.0.12 joulescope driver, the LabVIEW process starts but runs very slowly. Since subprocess.run blocks, the python capture does not return on time, either.
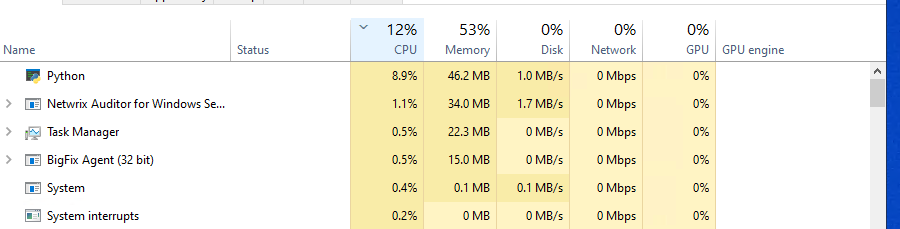
Are you seeing processing starvation? What does Task Manager show for CPU utilization and RAM utilization while the LabVIEW code is trying to do its thing?
So WEIRD. Now the build is running. The data capture didn’t get the right thing, but the build isnt hanging. I was remoted into the PC and watching the task manager while the build was running from the CI.
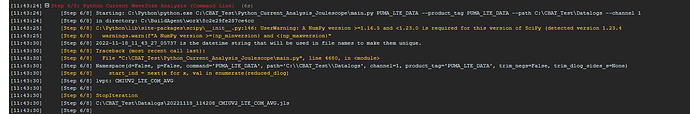
This is showing up in the build log:
I know whats going on with the stop iteration. I am working a fix for that now.
Looks like you need to update scipy:
pip3 install -U scipy
However, this looks like it is from the analysis, not capture, command.
Upgraded scipy library. Working on the stop iteration now.
The STOP ITERATION error is tied to the code not being able to find a valid radio signal in the data capture. I’ve put better error handling in place.
So, I had a thought. What happens if you start the python capture without --command and then manually launch the LabVIEW command from a separate Windows command prompt? Do you still see the strange behavior? I was looking into subprocess, and it’s not entirely the same as starting a new command from the command line.
I’ll give it a try now.
With version JS 1.0.12, the LabVIEW command in a separate command prompt does not work.
With version JS 0.9.11, the LabVIEW command in a separate command prompt works.
Could JS 1.0.12 be blocking all serial port communication?
Ok, you see the same behavior launching individually from the command line, so it’s not subprocess.
It shouldn’t. It is only supposed to connect to Joulescope devices. The hotplug detection and device scanning is very similar between the implementations.
Here are some things that are different between 0.9 and 1.x:
THREAD_PRIORITY_ABOVE_NORMAL priority on Windows.Both have different memory spaces than the LabVIEW code, so memory corruption should not be a thing. It could somehow be OS-level, like USB stack usage. I think that WinUSB usage is very similar, but it’s not exact.
Some things to try with python_datalogger.py:
device.stream_process_register(recorder). Any change?device.start(stop_fn=on_stop, duration=args.duration). Does the LabVIEW code run correctly? (the script will not exit since on_stop will never be called).Commenting this line showed some promise. The code to communicate the command to the radio appears to work now. I see the proper response from the radio saying it confirmed the command. However, rather than seeing a datalog file with 70 seconds of data, two 2kb files were produced. I ran this twice and saw the same behavior.
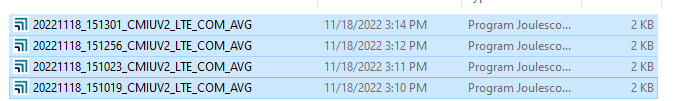
Files written at separate times.
The first short file was because I had a one sec duration with the command --command python -VV
But the duration for the second capture was ignored …
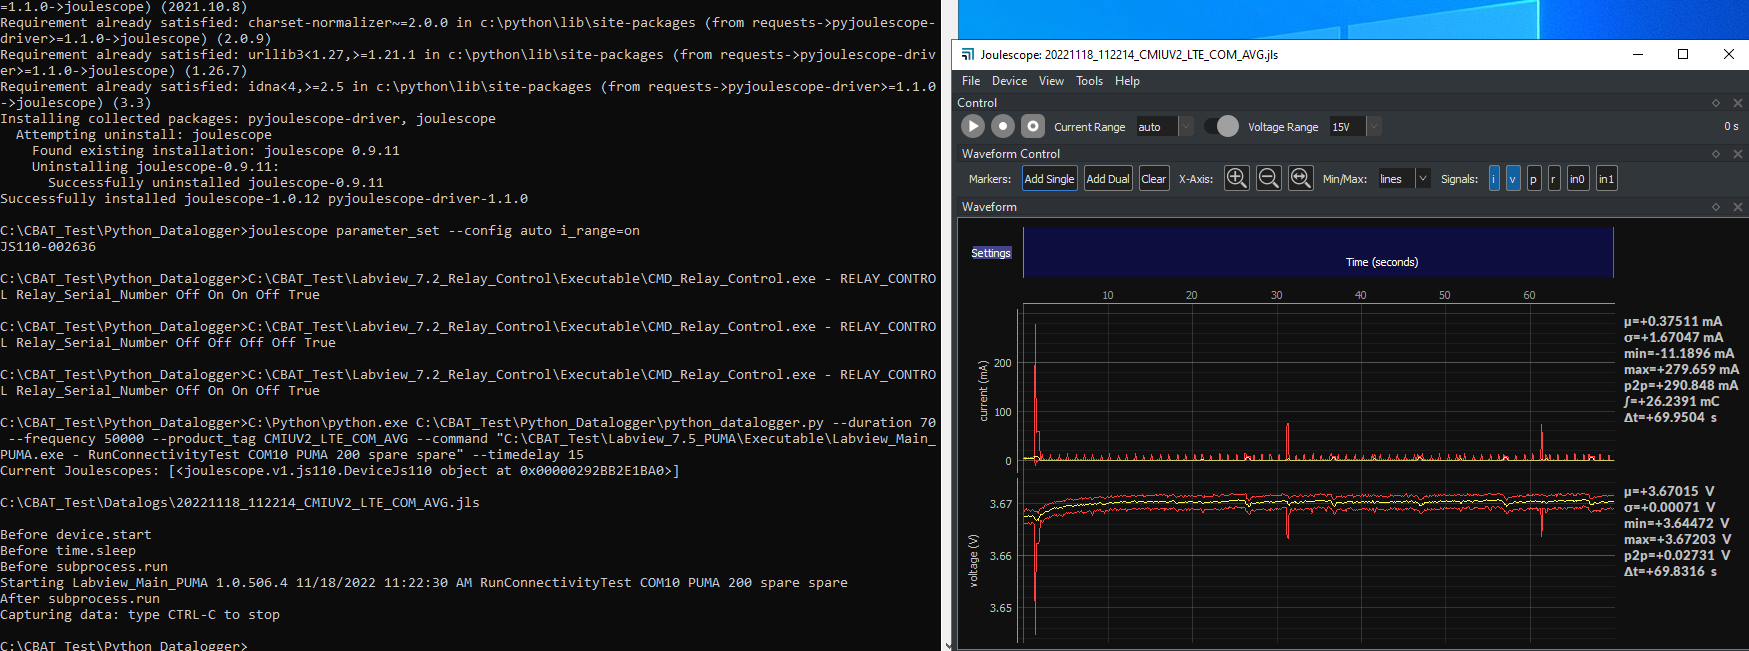
With this as my command: C:\Python\python.exe C:\CBAT_Test\Python_Datalogger\python_datalogger.py --duration 70 --frequency 50000 --product_tag CMIUV2_LTE_COM_AVG --command “C:\CBAT_Test\Labview_7.5_PUMA\Executable\Labview_Main_PUMA.exe - RunConnectivityTest COM10 PUMA 200 spare spare” --timedelay 15
I’m still seeing just a 2 kb file.
C:\Python\python.exe C:\CBAT_Test\Python_Datalogger\python_datalogger.py --duration 70 --frequency 50000 --product_tag CMIUV2_LTE_COM_AVG --command “python -VV” --timedelay 15
Without the radio command, still seeing 2 kb file.
Well, that is interesting. The line device.stream_process_register(recorder) hooks up the streaming data to the data recorder. Without that line, the joulescope driver still works, but the data does not get sent to the JLS file. I would expect very small JLS files like you see with just the header & footer information, no data. This change also reduces the amount of CPU loading.
A few thoughts: