Hello,
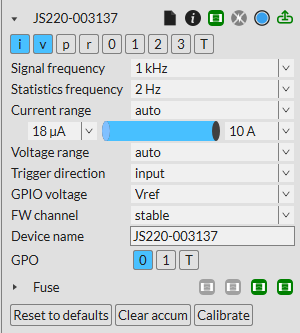
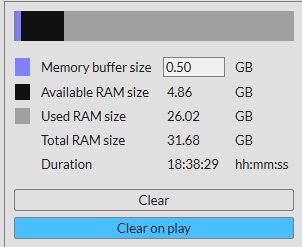
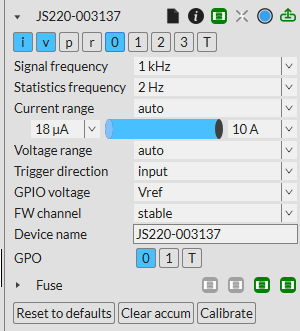
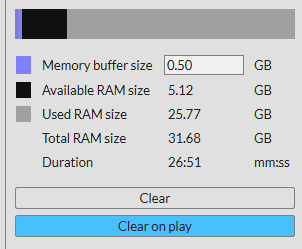
I’d like to record what happens to a particular signal during the power consumption capture but when I enable GPO 0, the recording duration drops from 18 hh to 26 m. Why does capturing this basic hi/lo signal significantly drop the recording duration and is there any way to get the capture back up to 18hh?
TIA
cherkey
Hi @cherkey,
Do you mean the RAM buffer size and RAM buffer duration? Recordings are only limited by the size of your HDD or SSD.
Did you also mean IN 0 (general-purpose input 0) instead of GPO 0?
Have you enabled downsampling? What sampling frequency are you using?
As of today, downsampling only affects the current, voltage, and power signals, not the GPI signals. The GPI signals remain at 2 Msps.
Hi,
When I disable GPI 0, I can have a recording duration of ~18Hrs and when I enable GPI 0, the recording duration becomes ~26 min - See images:


Hi @cherkey,
Ok, so you have configured a 1 kHz sample rate. The GPI 0 is not affected by this sample rate in the current version of the Joulescope UI.
The duration you are viewing is the RAM buffer duration. If instead you press the sample record button on the sidebar, you can record for as long as you want. Instead of the samples staying in RAM, they are written to a JLS file on your HDD or SSD. You can later open this JLS file in the Joulescope UI.
Will recording to a JLS file work for you?
Hi,
So I’ll use Signal Sample Recording and that will record my full time length capture, I just won’t be able to Stream a live view due to the RAM buffer.
I’m running that now - this should be OK.
Thank you,
cherkey
OK, I’m using recording for my capture, I’m using 500Hz for a sample rate and ran the weekend. I have GPI 0 enabled. The file size is 8G. I realize that the sample rate has a lot to do with that. When I open 8G the file, reduce the visible data view to a shorter timeframe and export that view, I can get the filesize down to ~4G, however, if I hide the GPI 0 signal and export that view, the filesize is further reduced to <1G (~350M). So I guess the question still stands - why does the GPI signal immensely increase the filesize?
Hi @cherkey - It’s for the same reason as the RAM buffer. The GPI signals are always represented at the full 2 Msps rate in the UI. As of today, downsampling only applies to current, voltage and power.
We are working to add on-instrument downsampling, which will also include an option to downsample GPI signals. Digitial downsampling means different things to different people, so we have three modes: toggle on any change (default), first, majority.
Can you deal with the larger file sizes for the time being?
Hello,
Yes, I’ve been managing with the larger filesize so I’ll be OK. Glad to hear it’s on the roadmap and I look forward to being able to change the sample rate for GPI. I guess I was just so shocked at the size of the file for a simple on/off signal ![]() I do understand the need for a higher sample rate; it will be nice to be able to adjust that too.
I do understand the need for a higher sample rate; it will be nice to be able to adjust that too.
Thank you,
@cherkey - The JLS file format has some compression for digital signals. Otherwise, a single GPI signal is:
2000000/8 * 60 * 60 * 24 = 21.6 GB / day
We do not have a date yet for the GPI downsampling feature, but hopefully early next month!