Hi
I’m trying to understand why there are different rms and average readings for a positive DC current such as the following - I could be wrong but I thought there should only be a difference the signal crosses 0?
Thanks John
Hi
I’m trying to understand why there are different rms and average readings for a positive DC current such as the following - I could be wrong but I thought there should only be a difference the signal crosses 0?
Thanks John
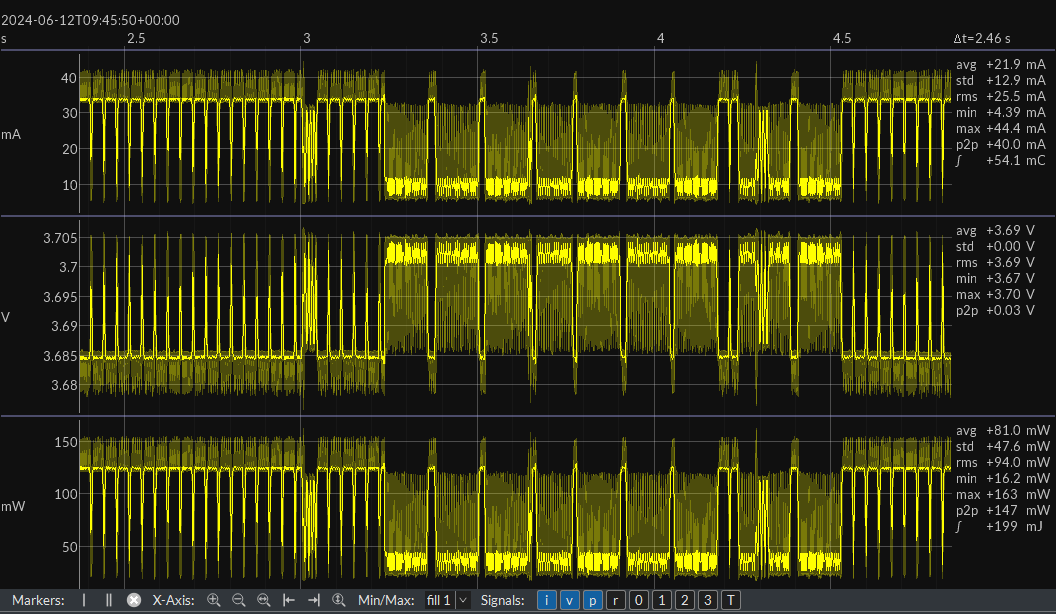
Hi @johnofleek - Well, average (mean) and root-mean-square are different equations:
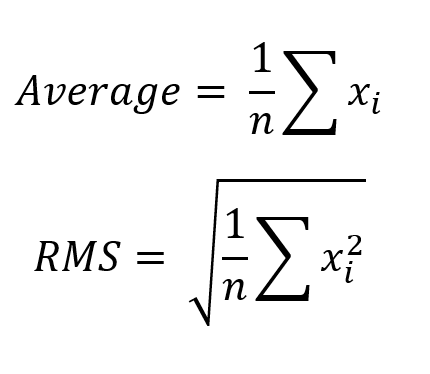
If all x values are the same, then average and RMS are the same as you indicated. However, any variation in x values will cause average and RMS to be different, even without zero crossings.
You can actually compute RMS in terms of average (mean) and standard deviation:
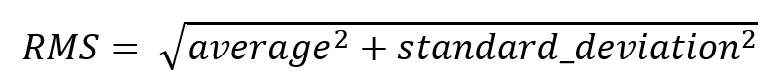
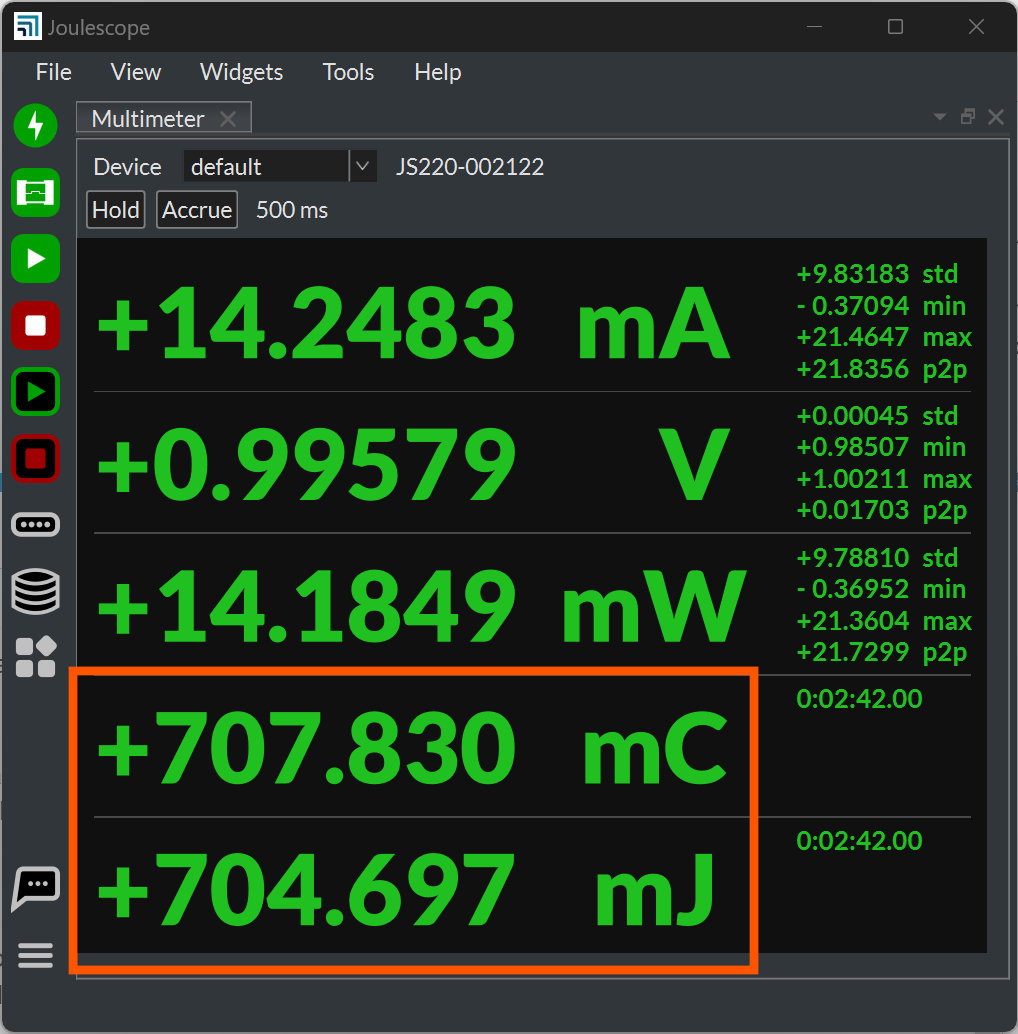
Checking the values displayed on the current waveform:
RMS = math.sqrt(21.9^2 + 12.9^2) = 25.42
which is within the truncation to 25.5 as shown.
Thanks
I’m trying to understand how arrive at an reasonably accurate current consumption for loads like the one shown which are not periodic.
I think that average is ok but also found this statement
" In the case of the RMS statistic of a random process, the expected value is used instead of the mean."
Hi @johnofleek ,
What is the timerange we are talking about of your monitoring? 1m, 1h, 1d where you are interested?
Eg.
––_________
or
–_––––_–––
In the end if you can find a periodicity it is about to find this one and compare timeranges where frames fit with this periodicity.
Hi @johnofleek - Your Joulescope produces lots of data. You can add dual markers to measure specific regions of interest. If you want to produce a histogram, you can do that, too. Add dual markers over the region of interest. Right-click on one of the markers and select Analysis → Histogram.
As @lukGWF mentioned, you can measure over a long enough duration where short-term variations average out. See Law of Large Numbers on Wikipedia. You Joulescope is accurate to about 0.1% (1 in 1000). If you select a long enough duration that you capture 1000 events, then the error will be instrument bounded rather than event bounded.
Does this make sense? If you want to explain more about why and what you want to measure, I am happy to try to figure out what metrics may work best.
Hi @miberty
I have had another think about this and would like to check something with you.
Is it correct that measuring energy usage (over long periods) using coloumb counting is not accurate for fixed input voltages and widely varying current loads - it would be better to use RMS based measurement calculations?
Hi @johnofleek - Charge and energy are different things. You can measure either accurately with your Joulescope JS220.
Charge is the integral of current over time
Energy is the integral of power over time
Power is current * voltage
Your JS220 computes both charge and energy for you by integrating the full-rate sample data. You can use those computations directly, no estimation required:
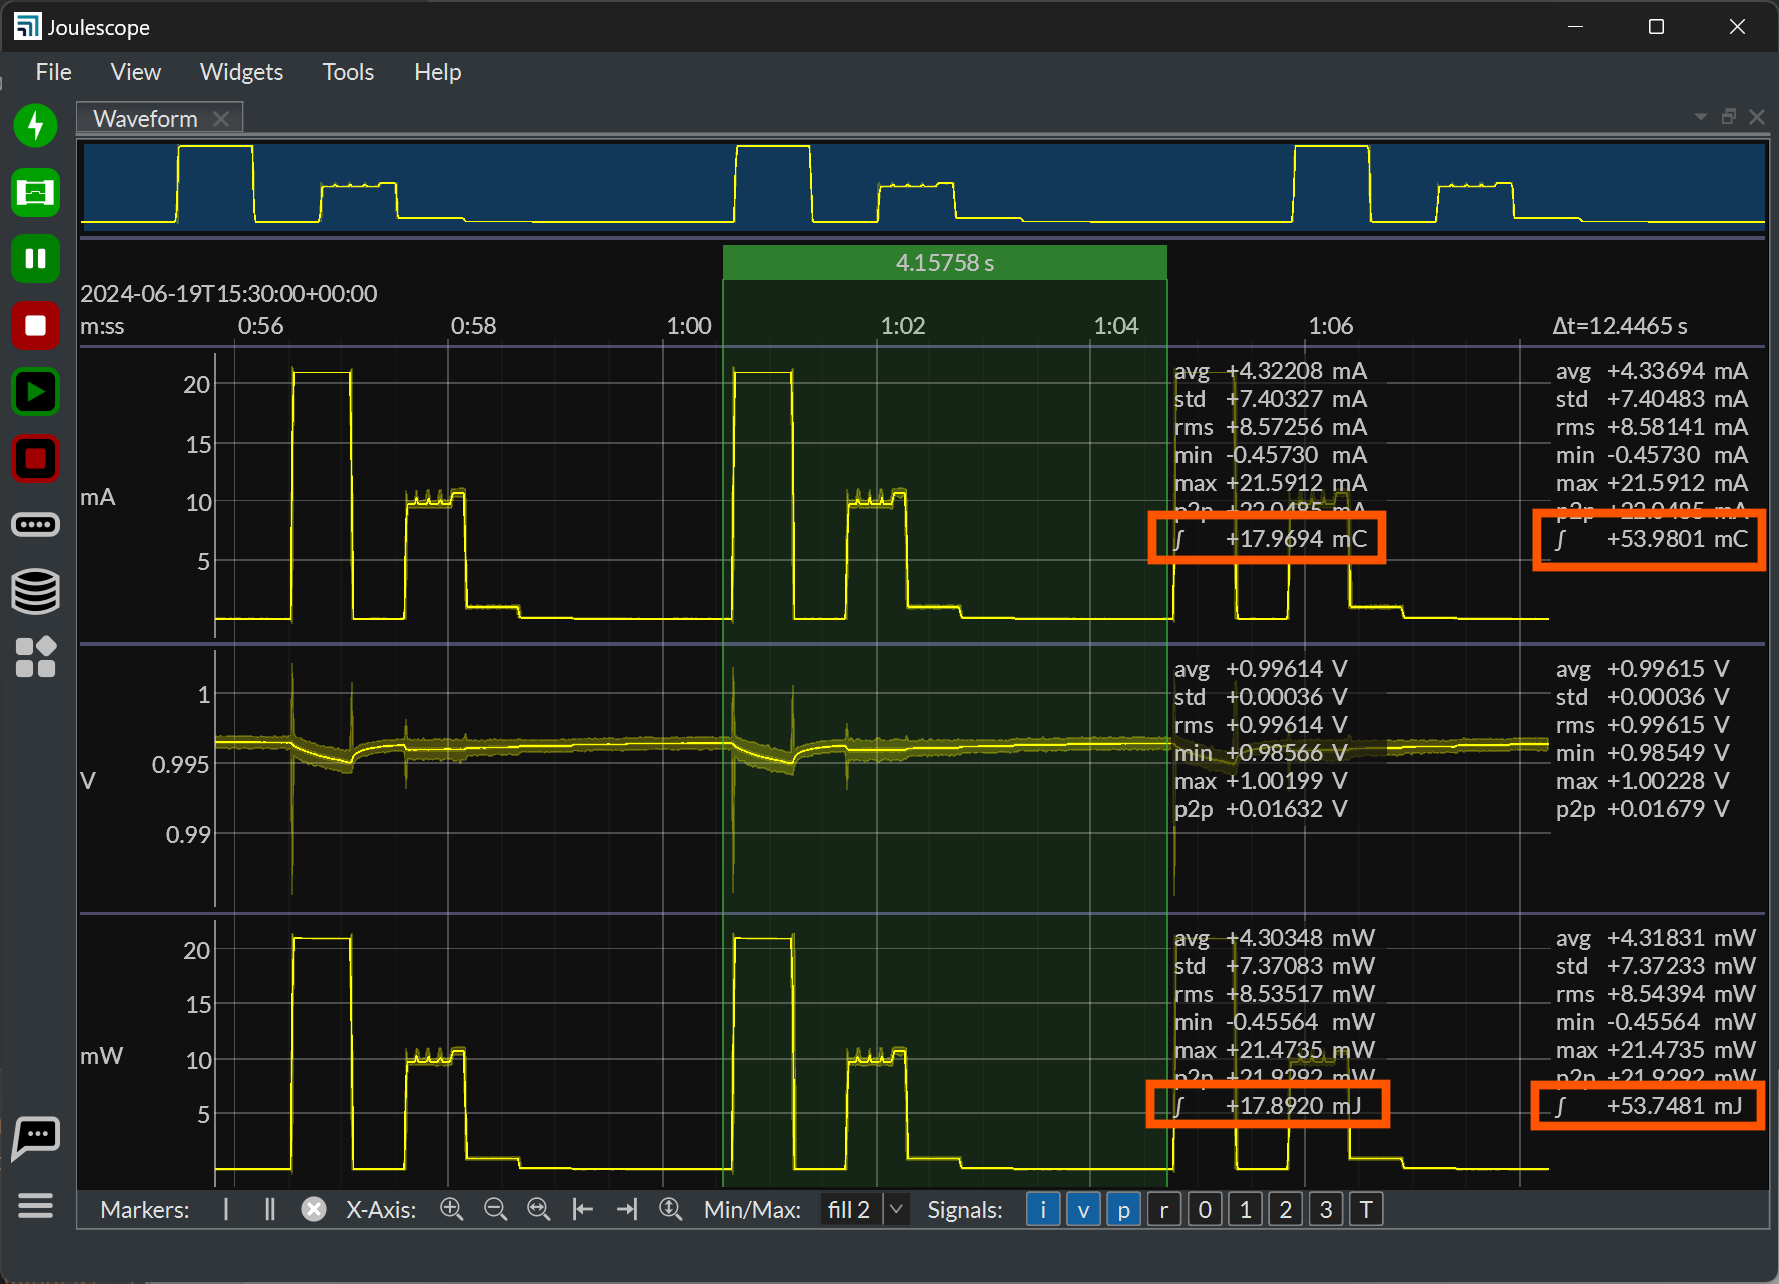
If you want to measure for long durations and do not care about the waveform, you can find the same measurements on the Multimeter View:
The JS220 is designed to have sufficient computational precision to make these measurements. We use 64-bit fixed point to compute average and 128-bit fixed-point arithmetic to compute variance.
Is this what you want?
Hi @miberty
Yes I can see your point regardiing the multimeter function (which I had ignored sorry). Does the calculation the multimeter uses work in a different way to the scope view?
Can the multimeter measurement be used over a window period / region of interest?
Hi @johnofleek - The Multimeter accumulated values are computed in the same way as the Waveform widget. The only difference is that Multimeter statistics with the JS220 are always computed on-instrument at full sample rate. Therefore, they are not affected by any USB communication glitches. If you configure the UI for a slower sampling rate (downsample), then the Waveform widget will compute the integral on the downsampled rate, not the full rate. This does not matter for charge, but it can affect the power & energy computation if current and voltage are not in phase.
With the Multimeter widget, charge and energy accumulate indefinitely. You can clear them by selecting Tools → Clear accumulators. If you want to pause the display, press the Hold button in the Multimeter widget.