Current value changes with current range

Hello!

I am using the JS110 tool and I have to say it is really cool! This is my first analyzer tool (worked with oscilloscope and small resistor in series up to now to measure the current). The think is that when I change the range, then the power consumption seems to change in both oscilloscope and multimeter as well. I know that I am missing something here, so could you please help me find out what? Below the 4 measurements are done on the exact same board, but with different measurement range (see the red arrows). For range >= 180mA I get negative values for current!

Thanks in advance

Hi @alexxx ! Welcome to the forum, and thanks for selecting Joulescope for your measurement needs!

If I understand correctly, you are attempting to measure a target with something like 10 µA sleep current with some spikes to about 1 mA. I normally recommend using the default auto Current Range and allowing your Joulescope to autorange as it’s designed to do. However, if you select a fixed range, you have to be more aware of saturation and precision.

Here are the Joulescope accuracy specifications from page 12 of the Joulescope User’s Guide:

So, when you manually select the 2A range, the expected value is 0.010 mA * 0.003 ± 1.5 mA. In this range, the offset error is significantly bigger than your signal.

You may be able to select the 1.8 mA range if you want a fixed range. However, if your target ever draws more than 1.8 mA, then the measurement will saturate, so your energy and charge will be lower than the actual. If you manually select the 180 µA range, the measurement will definitely saturate.

With autoranging, your Joulescope will select the best current range to give you the highest accuracy. Then, as the current demands increase, your Joulescope changes the current range within 1.2 µs so that your target device keeps working.

Does this make sense and answer your question?

Hi @mliberty! Thank you for the detailed explanation. Yes it absolutely makes sense! But the auto range still confuses me a bit. I took a look in the user guide and in page 16 it is noted that “Current Range allows you to select Joulescope’s active shunt resistor.” So when the device wakes up, we see that the current range changes. So far so good.

On the other hand if you see the image below, there is a value changing (+5 when it sleeps and +3 when it wakes up). What do those values mean? How can I evaluate those values to make sense for the measurement?

Thanks.

The current ranges are numbered in order like so:
0: 10 A
1: 2 A
2: 180 mA
3: 18 mA
4: 1.8 mA
5: 180 µA
6: 18 µA

Based upon the image above, your Joulescope starts by measuring sleep current in the 180 µA range (5). When the target device wakes up, the Joulescope jumps to the 18 mA range (3) before dropping back to the 1.8 mA (4) range and finally returning to the 180 µA range (5).

Does this make sense for your measurement and test setup?

Aaah I see! Great thanks. Two more questions (and hopefully last).

  1. I draw very small current (~2uA). But I observe that although the average value is correct (~2uA) there are big negative spikes of -40uA! This happens only in autorange. How can we explain this?

  2. When I change the current range, I get different peak values. Also when I zoom in I get different peak values.
    a. When I have it in 180mA the peak value starts from 1.2mA and ends up to 4.5mA as I zoom in from 1 to 2.

b. When I have it in autorange the peak value starts from 2.5 mA and ends up to 2A (!) as I zoom in from 1 to 3.

So what is the actual peak value? I am confused.

Thanks for the support @mliberty!

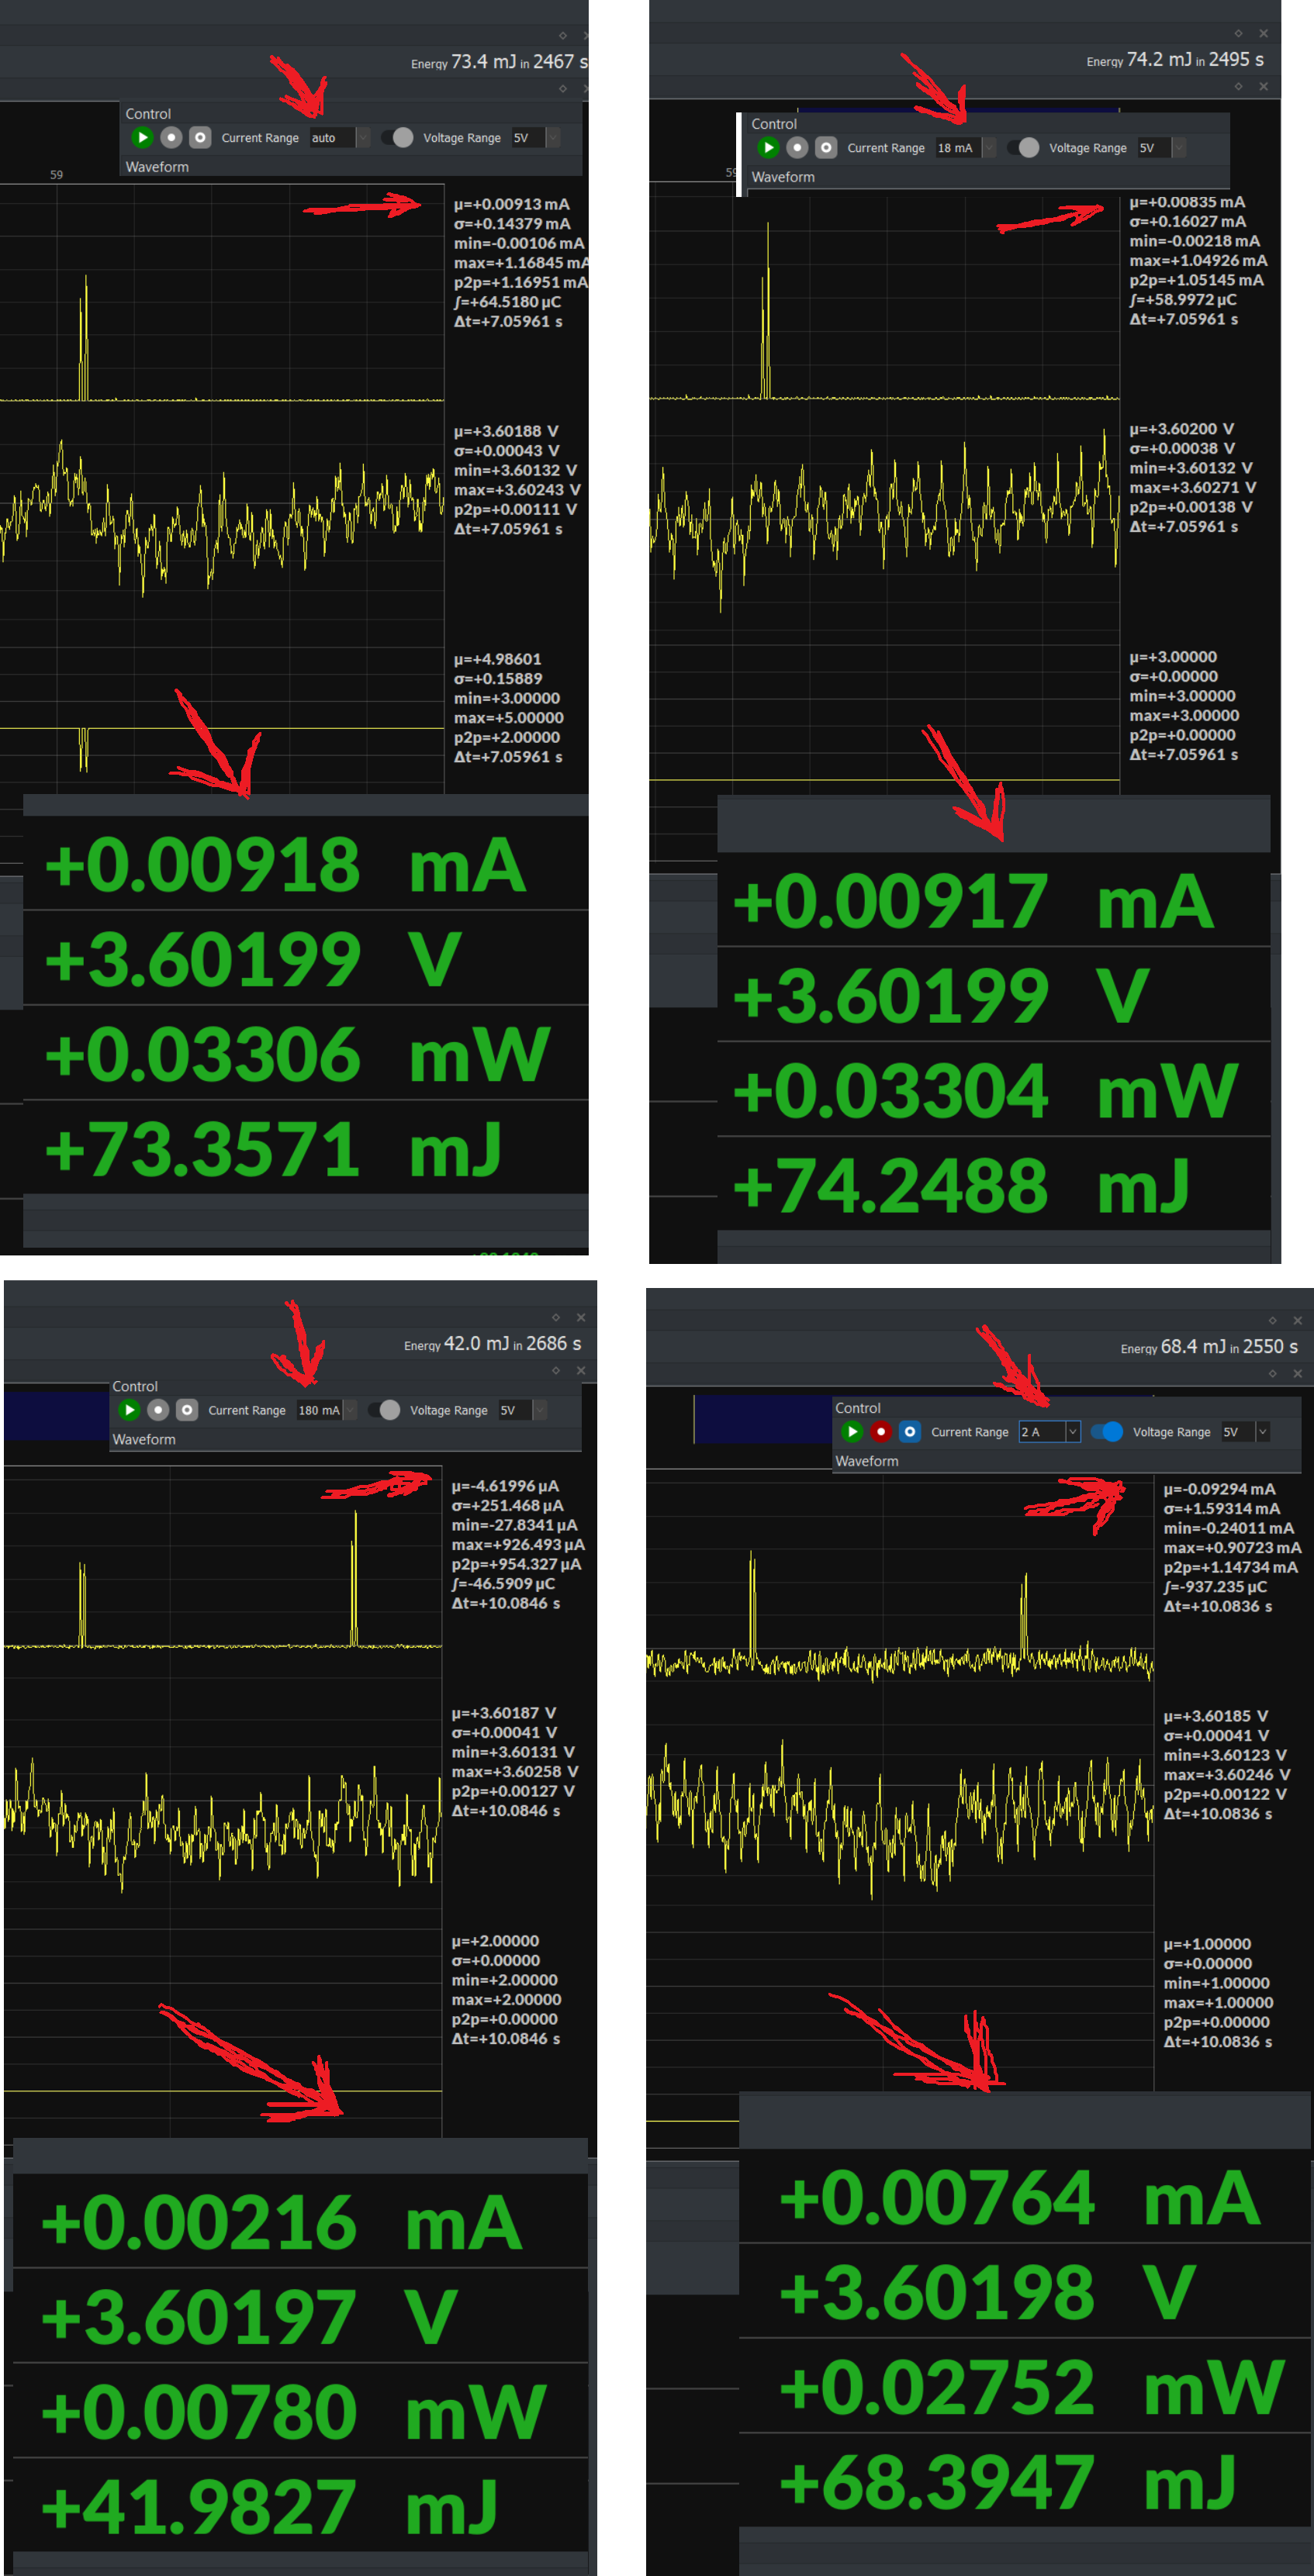
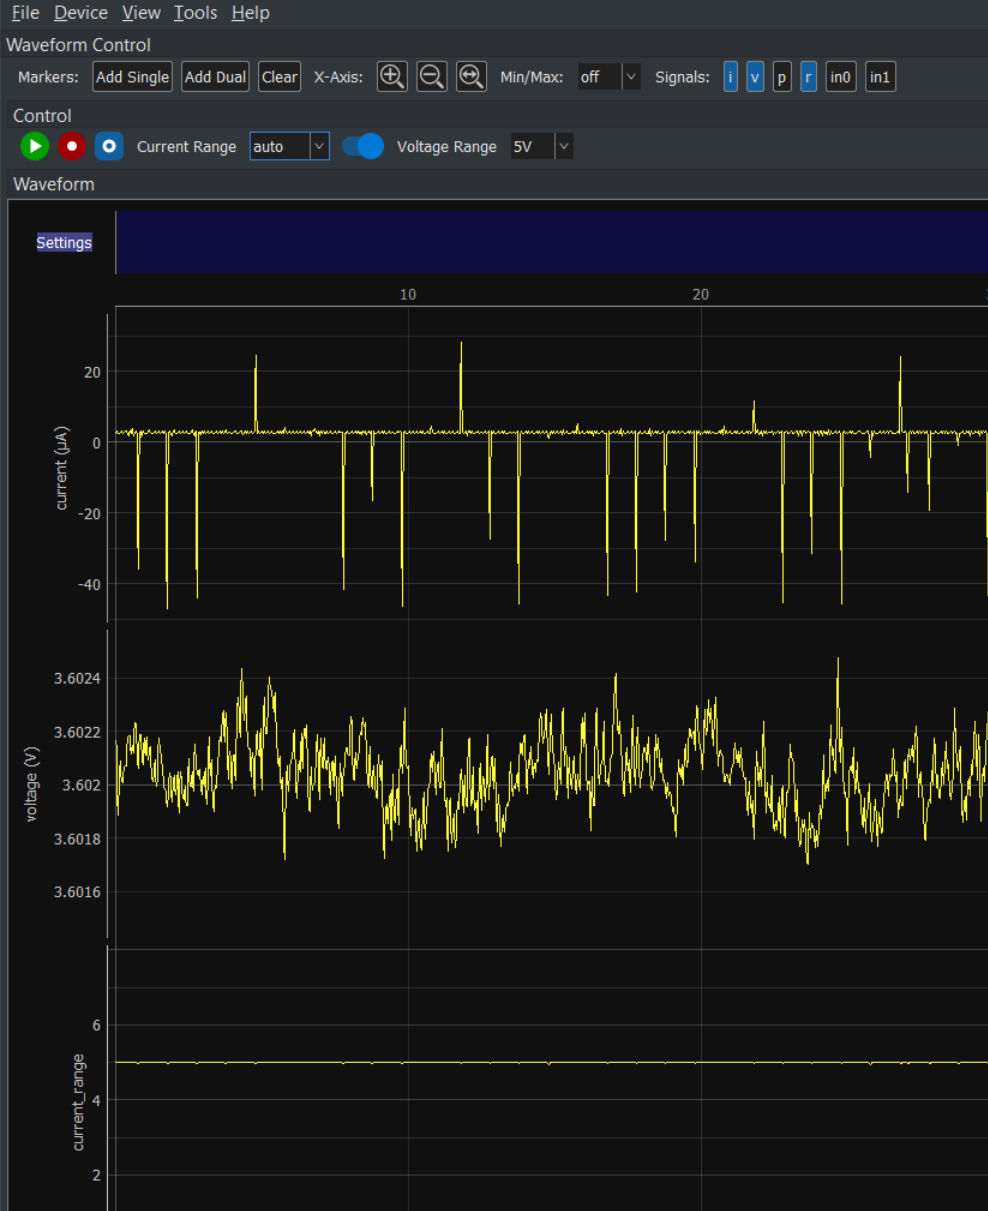
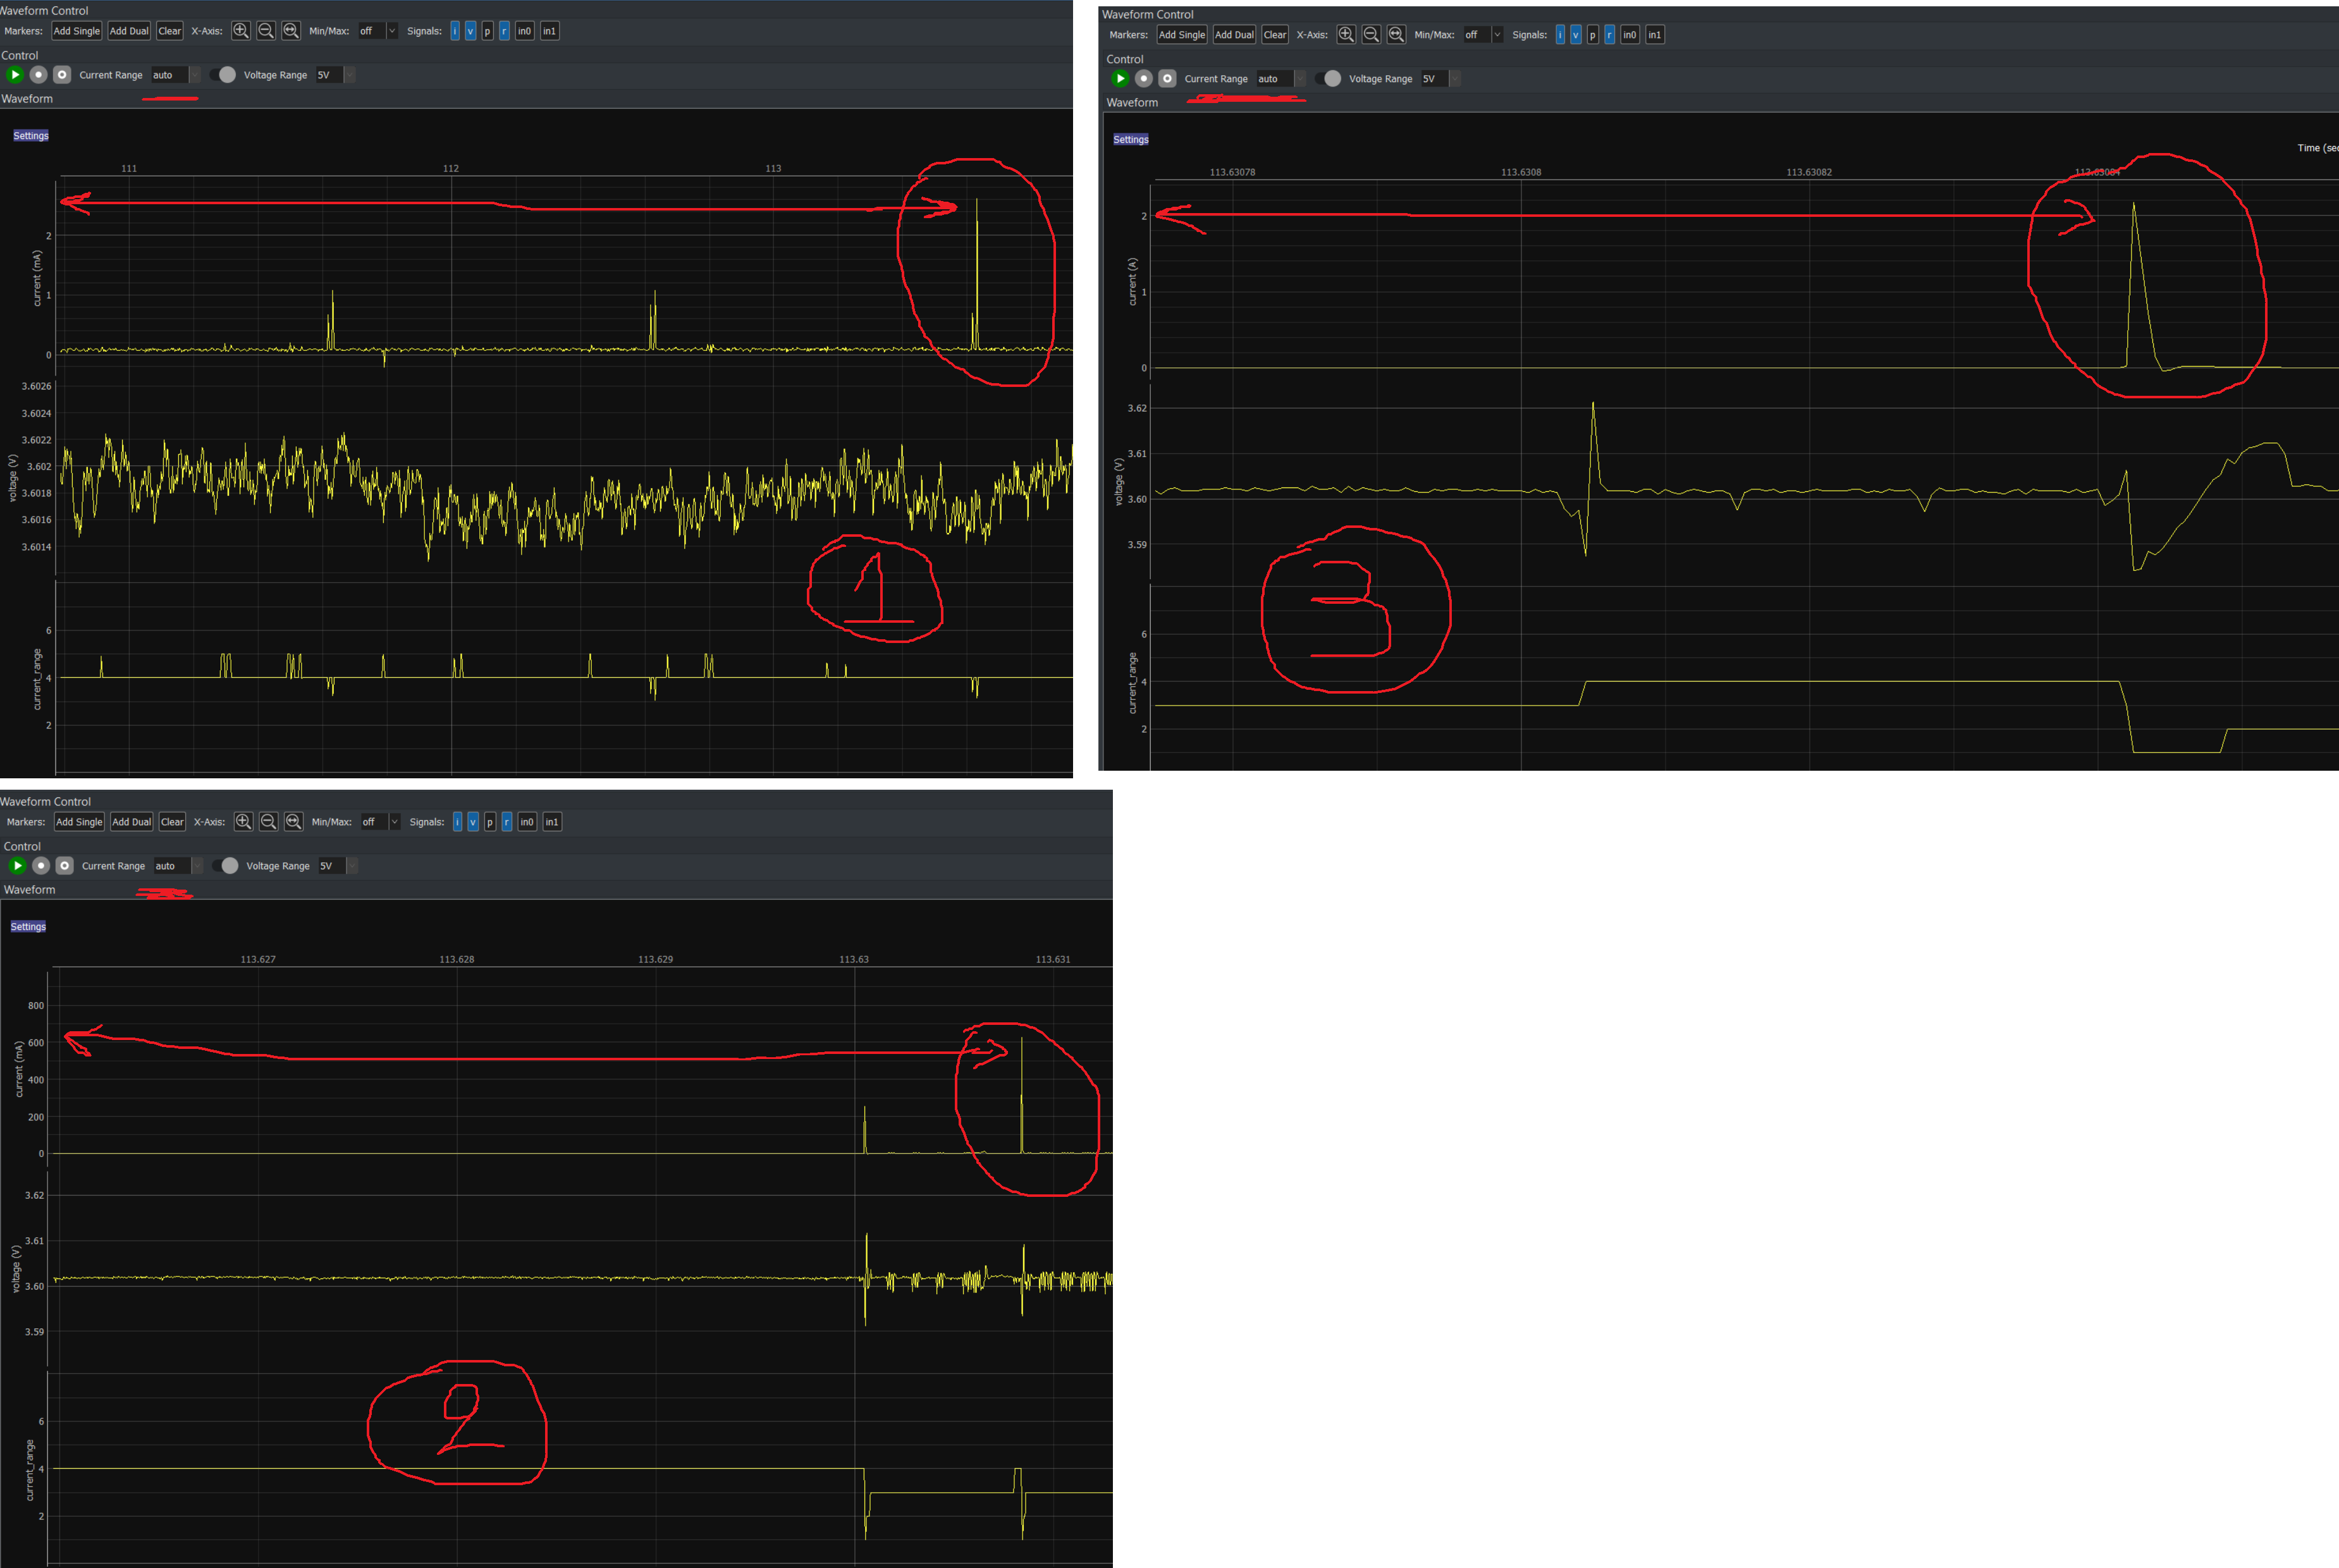
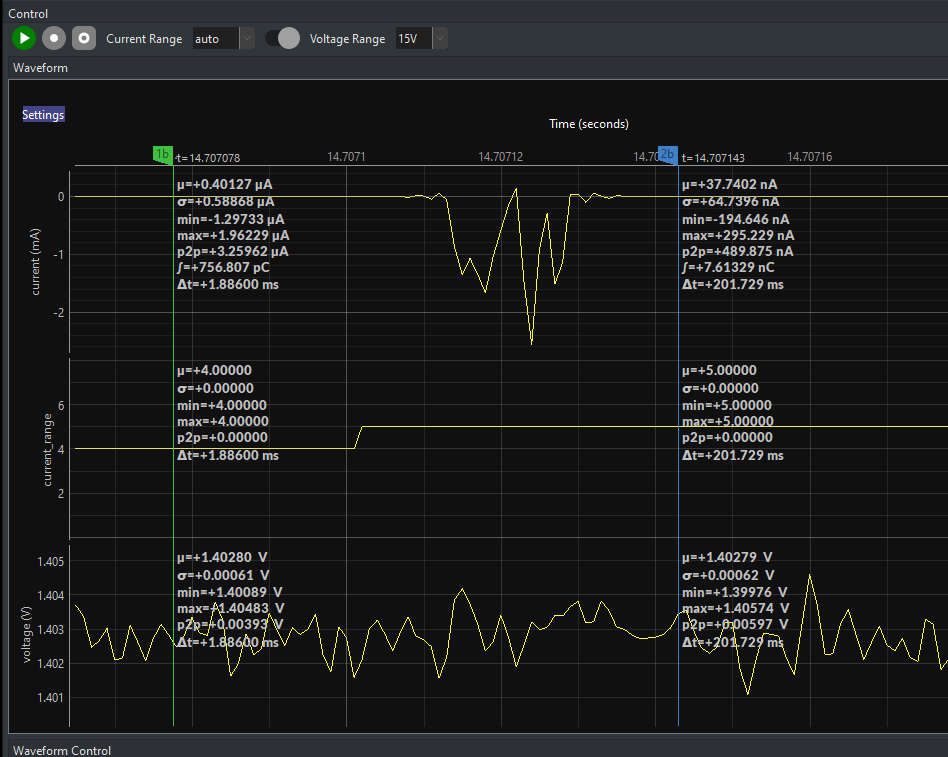
I see that you turned off min/max. If you are concerned about min/max values, you should keep that on. The yellow line is the mean (average) value.

Your Joulescope collects samples 2 million times per second. When you are zoomed out in the UI, your screen cannot display that many individual points. Instead, each x-axis pixel on your screen may represent many, many samples. Each pixel on the yellow line is the mean of all samples for that pixel. The min line is the minimum value computed over each sample represented by that pixel, and the max line is the maximum value computed over each sample represented by that pixel. So, as you zoom in and out, the yellow line will change shape because each pixel represents different samples.

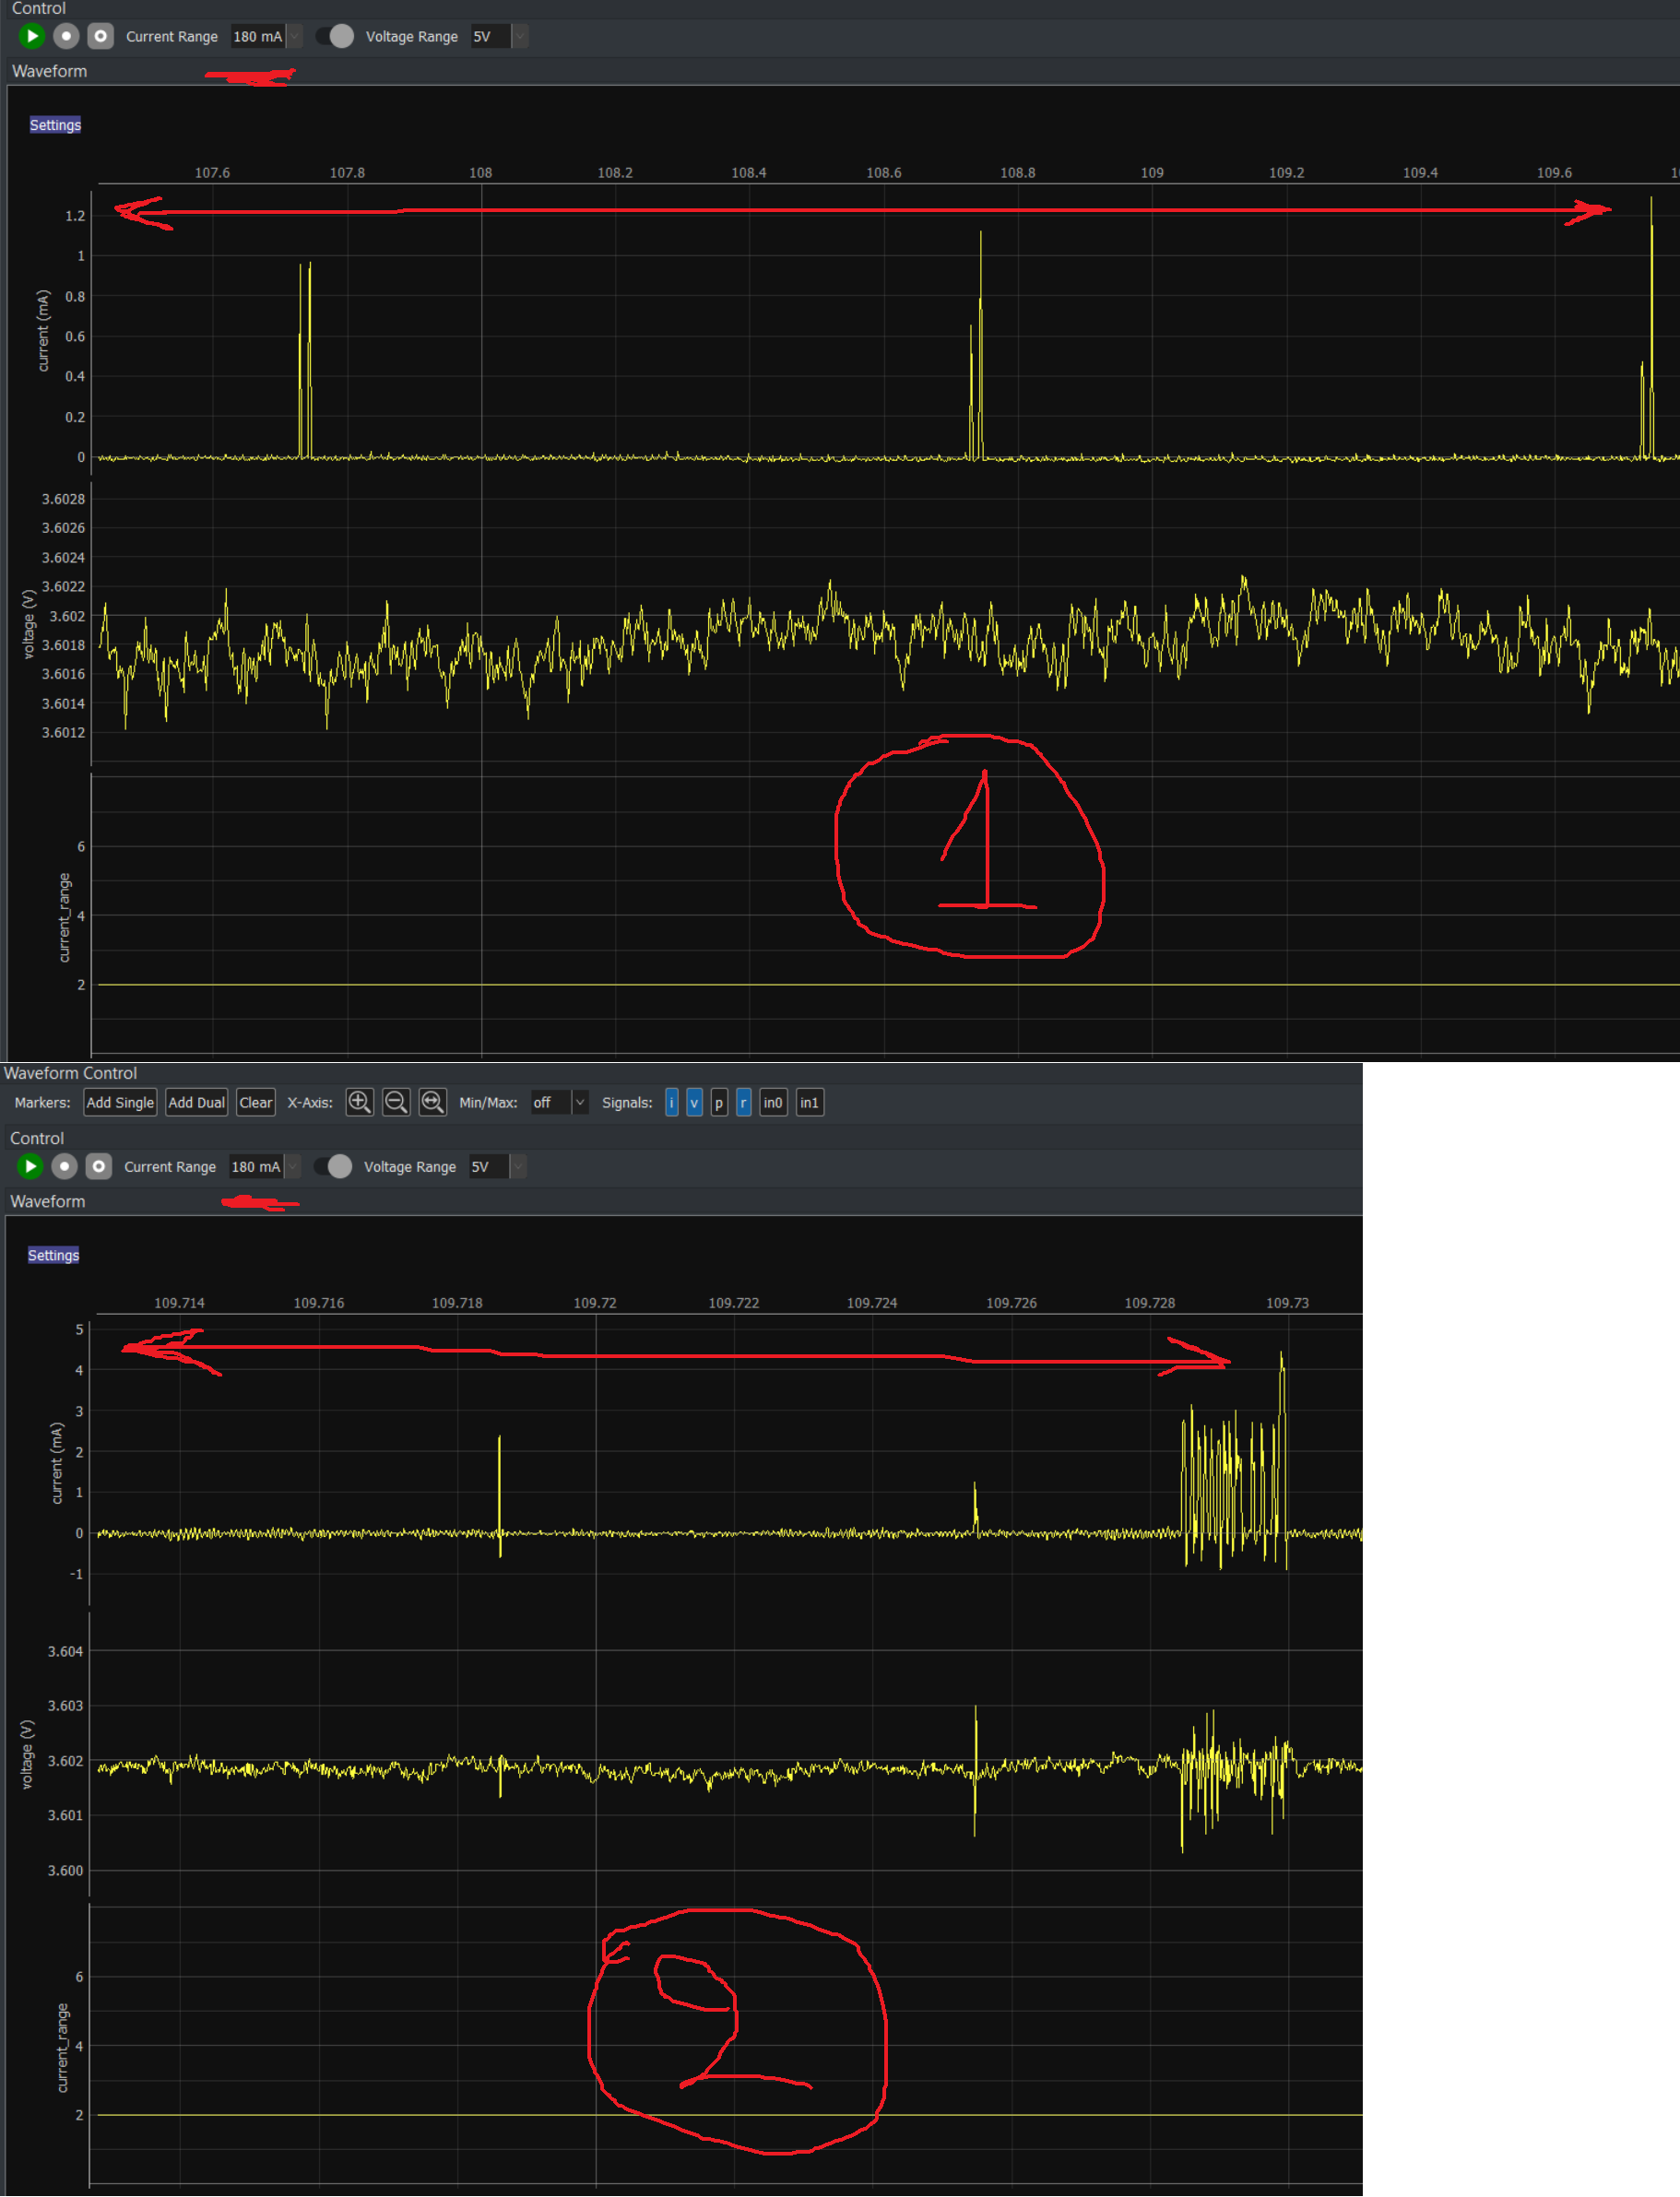
From another perspective, computing mean is a low-pass filter. As you zoom in, you increase the low-pass cut-off frequency. As you zoom out, you are decreasing the low-pass cut-off frequency. So, you are viewing the same signal at different bandwidths, which can change it’s shape.

When you are fully zoomed in, you see the actual samples, not the mean, so the shape will no longer change.


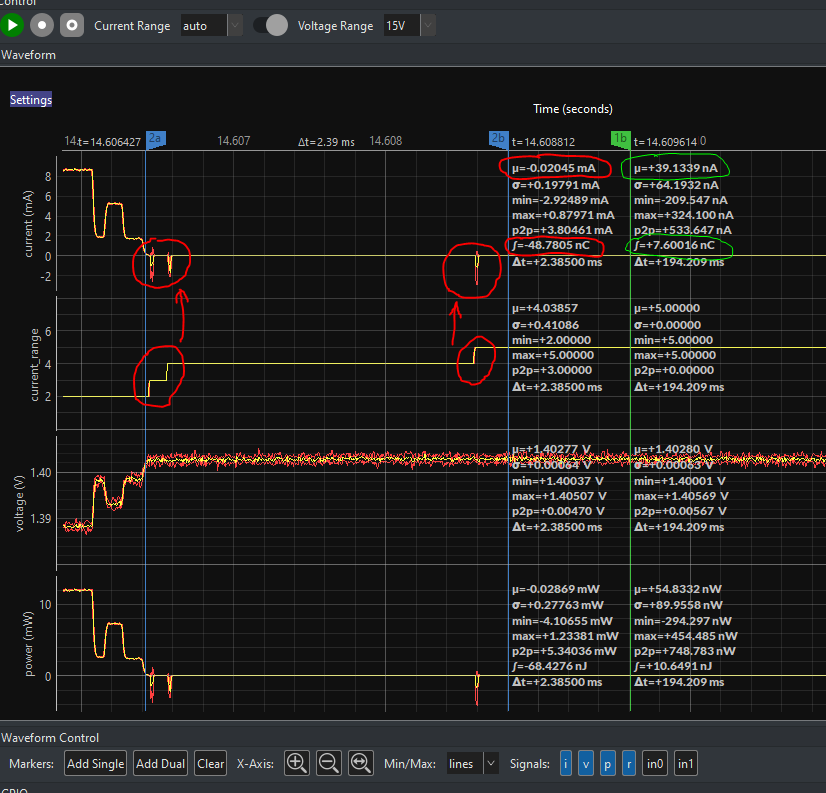
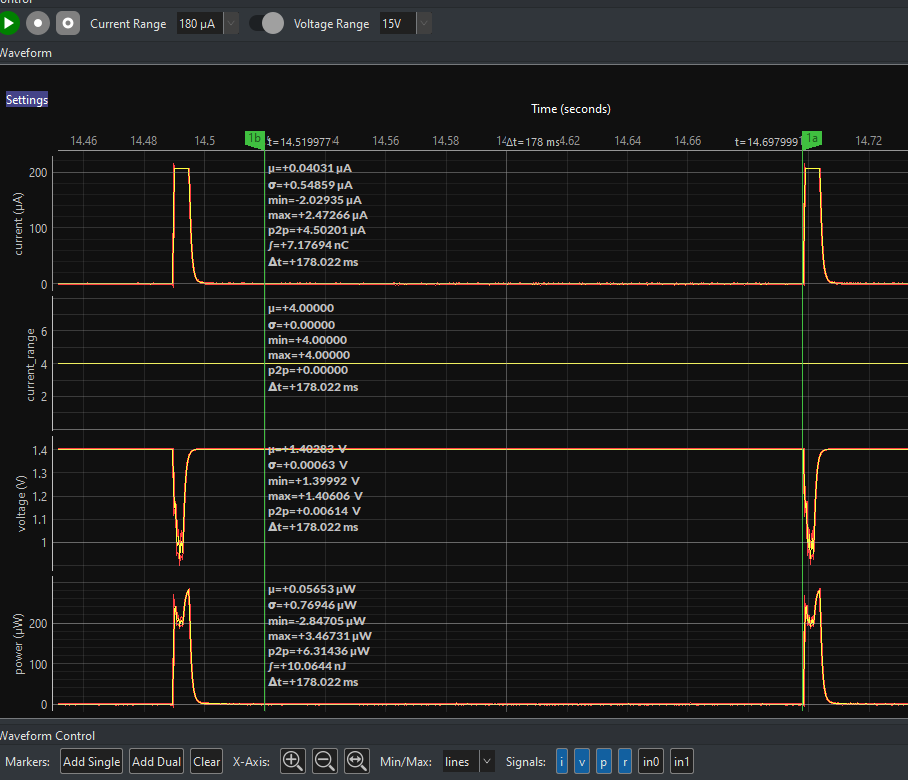
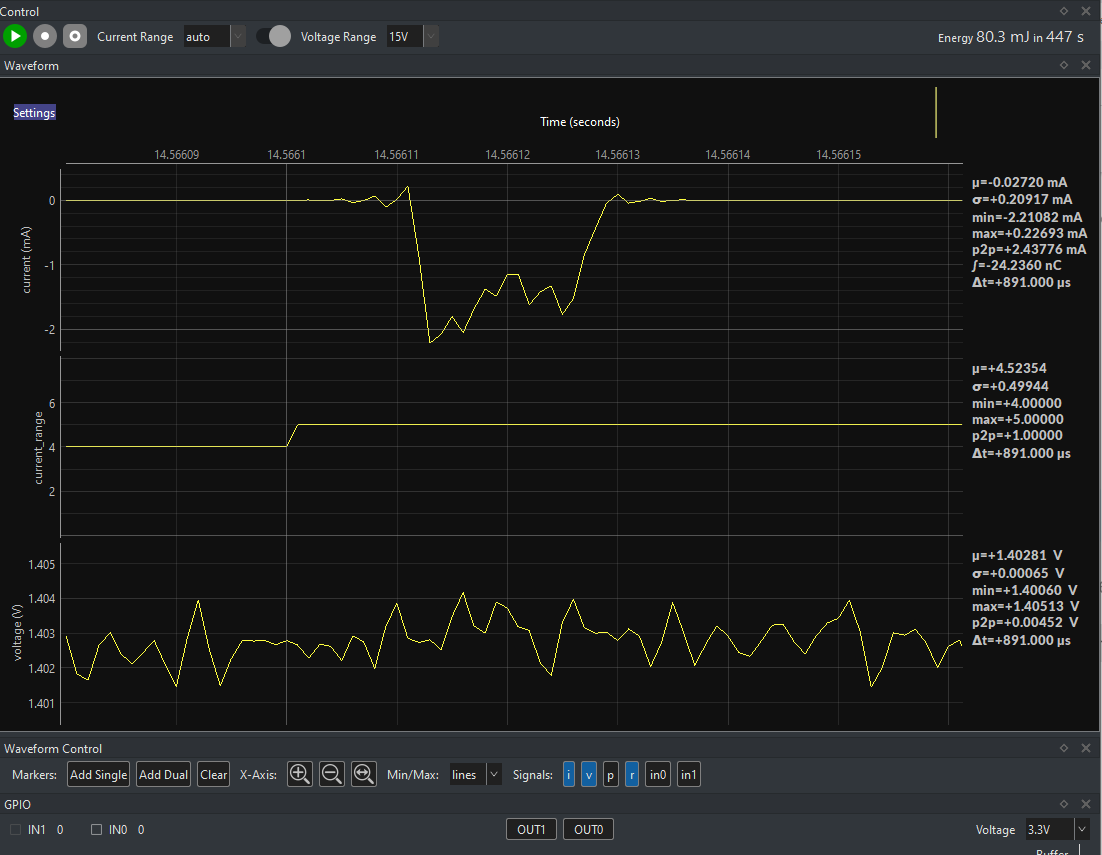
So, what’s up with the “spiky” events near current range switches? You have a circuit with a power supply, wires, Joulescope, and your target board. Joulescope is effectively a variable resistor. Your target board is a capacitor (bypass capacitance) in parallel with a variable resistor. Your wires are resistive and inductive, but you can often neglect these effects.

The current flowing through Joulescope creates a slight voltage drop, called burden voltage. According to Ohm’s law, voltage = current * resistance. Your Joulescope does a great job keeping this voltage very small, typically less than 20 mV. However, it’s not zero. When resistance changes, so does that voltage drop. However, the capacitance on the target resists that change. When the shunt resistor changes, the target capacitance needs to charge up or discharge to match the new burden voltage, and you can get large positive and negative spikes. This is real current! If you measure the RC time constant, you already know R (Joulescope shunt resistance), so you can compute your target capacitance. Since this is real current, it does not affect the accuracy of your measurement, but it is not entirely intuitive either.

For more detail, see this post.

Thank you very much @mliberty!
This is a detailed explanation and throws light on all my questions. I will continue using the tool extensively within the next few days and if something extra is required, I will let you know.

Have a nice day.

1 Like

I think I add my observation and question to this topic.
I also see irregularities on the current waveform caused by auto-ranging, see attached screenshot.

In my case, range switching happens three times when DUT goes to sleep. As result, the current is measured negative while range changes (2a-2b). Following the last auto-range switch on the screenshot my DUT stays sleeping for about 200ms, and current measurement (1b - 1a, marker 1a is far on the right not visible) is about 40nA which I tend to think is correct.

If I use fixed range 180uA then I see no glitches and good sleep current, but of course the event current saturates and power is wrong.

So my question is, can the negative current measurement be trusted when I use auto-range? It seems the negative accumulation during 2.4ms is offsetting my positive sleep current accumulation over almost 200ms. In other words, should I remove current glitches from the waveform (as erroneous artifacts of auto-range) by some post-processing, or must include them in total current/power accumulation over entire (event+sleep) time?

When your Joulescope changes current ranges to a more sensitive range, it changes the shunt resistor to a larger value. According to Ohm’s law V = I R. At the moment that R increases, the target voltage is too high. This can cause real current to flow from the target bypass capacitors back to the source. Likewise, when R decreases, extra real current flows from the source to charge up the target bypass capacitors. These are real currents that average out.

The JS220 also significantly improves measurement during current range changes. The JS110 has up to a 5 µs blind spot after autoranging. The JS220’s new Enwavify™ technology continues measuring current during current range changes using additional hardware for improved accuracy.

Which instrument are you using: the JS110 or JS220?

Could you zoom in on one of the negative current events above and post the image? I would expect to see an exponential RC curve, assuming a mostly capacitive load, but we may see RLC-dampened ringing, too.

Forgot to mention, I’m using JS220. Here is zoom to the last auto-range switch before long sleep, sleep current about 40nA.


Technically my DUT is already sleeping for about 2ms at the time of this auto-range. I see a mix: partial ringing, partial exponential on current waveform.

So, you think I should treat those glitches as real thing and include them into total charge accumulation? It’s a bit confusing. I’m trying to separate my sleep current measurements from event current measurements. Those glitches happen after event is complete, i.e. when DUT is in sleep mode. But if I add glitches to sleep accumulation, my sleep current would be negative, which is plain wrong. On the other hand I know that glitches are caused by auto-ranging, so I’m tempted to ignore them as artifacts, just replace with known sleep current samples. Simple as it seems, I’m still not sure that is right thing to do.

UPD: Here is another zoomed example of the same auto-range transition. Looks like current samples within the glitch are quite random. I added dual markers on either side of the glitch (only “b” markers visible on screen) that contain sleep period and have no auto-range transitions between “a” and “b”.

Hi @inlevis and thank you for the image. What you are seeing is purely the JS220 internal current range switching artifacts.

In the first image, it looks like the current range switch takes about 15 samples at 1 Msps = 15 µs.

In the second, the duration looks closer to 12 µs, with somewhat better error total.

The JS220 has additional hardware that bounds the error to mA during current range switches. However, it should typically be much better with only ~2 µs of less accurate samples. In both cases above, you are seeing the JS220’s worst-case current range switching transition. This should be a pretty straightforward current range transition for the JS220, so I do not know why the error is larger than I would expect. We will investigate.

In the meantime, you are correct to consider these events as purely JS220 auto-ranging artifacts. At 38 nA, the voltage difference across the JS220 shunt resistor changing from 111 Ω to 1111 Ω is only 38e-9 * (1111 - 111) = 38 µV, which is not enough to worry about the system RC charge/discharge.


BTW: 38 nA sleep current is very impressive! You will likely need to instruct your assembly house on flux residue and fingerprints. Also, quality bypass caps are crucial.

Thanks @mliberty, now I better understand my measurements.
UPD: I tried the same experiment on another instance of JS220, with similar outcome. So it is more likely to be internal property than defective unit.
BTW I’m curious, what type of ADC is used in JS220 current sampling, I mean sigma-delta type or SAR type, or other?

We use 16-bit SAR ADCs running at 2 Msps. The JS220 has 4 channels: voltage, current, and two for Enwavify™.

Good to know that this is consistent from unit to unit. Otherwise, I have even more to worry about :wink:

The good news is that even at the current performance, this JS220 switching provides better accuracy than the JS110 (and really anything else on the market for anywhere close to the same price). The bad news (for me at least) is that I know Enwavify™ should be doing even better in this case… We have work to do!