It would be great to be able to label the different traces. One could use the Notes functionality to accomplish the same goal but sometimes it’s nice to be able to see what you;re looking at.
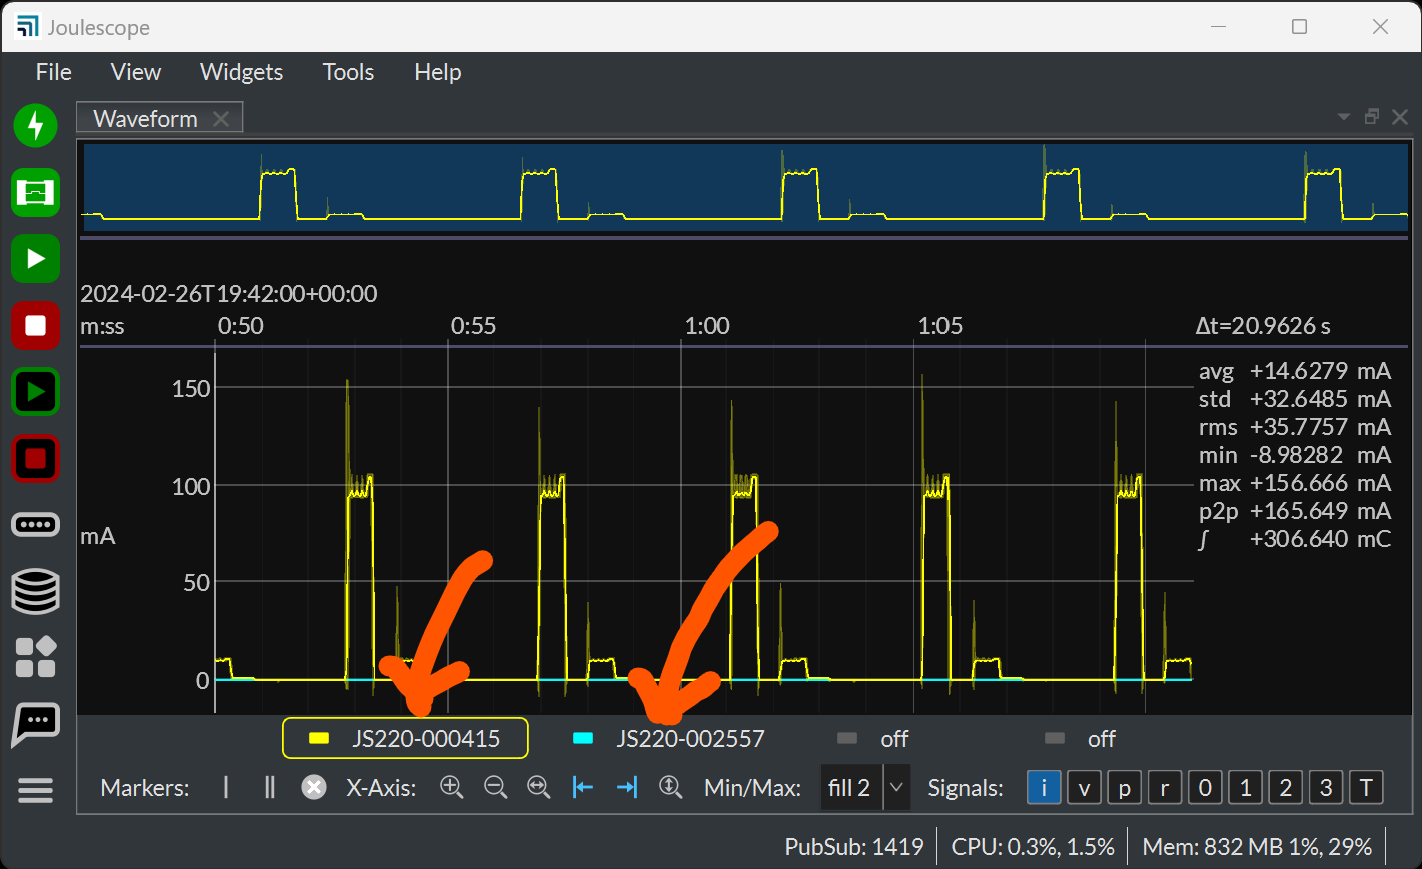
Hi @maynarde and welcome to the Joulescope forum! Thanks for the suggestion. To confirm that I understand, are you wanting to be able to set the text here:
Although there was a slight chance that this might have already been implemented, it’s not. The UI does allow you to set the Device name, like this:
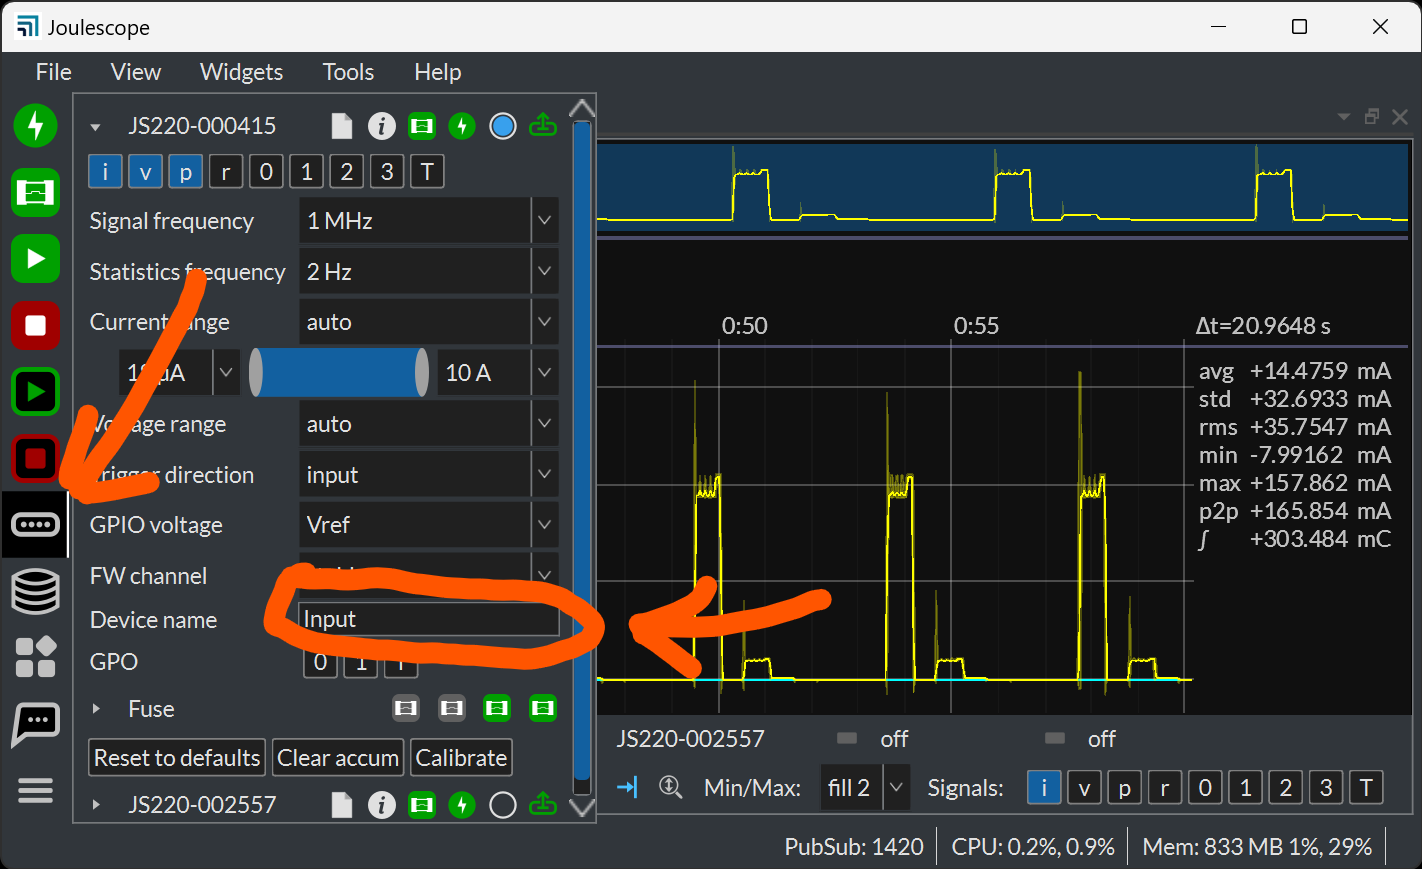
If the Waveform widget displays the Device name rather than the device-serial_number, does this give you want you want?
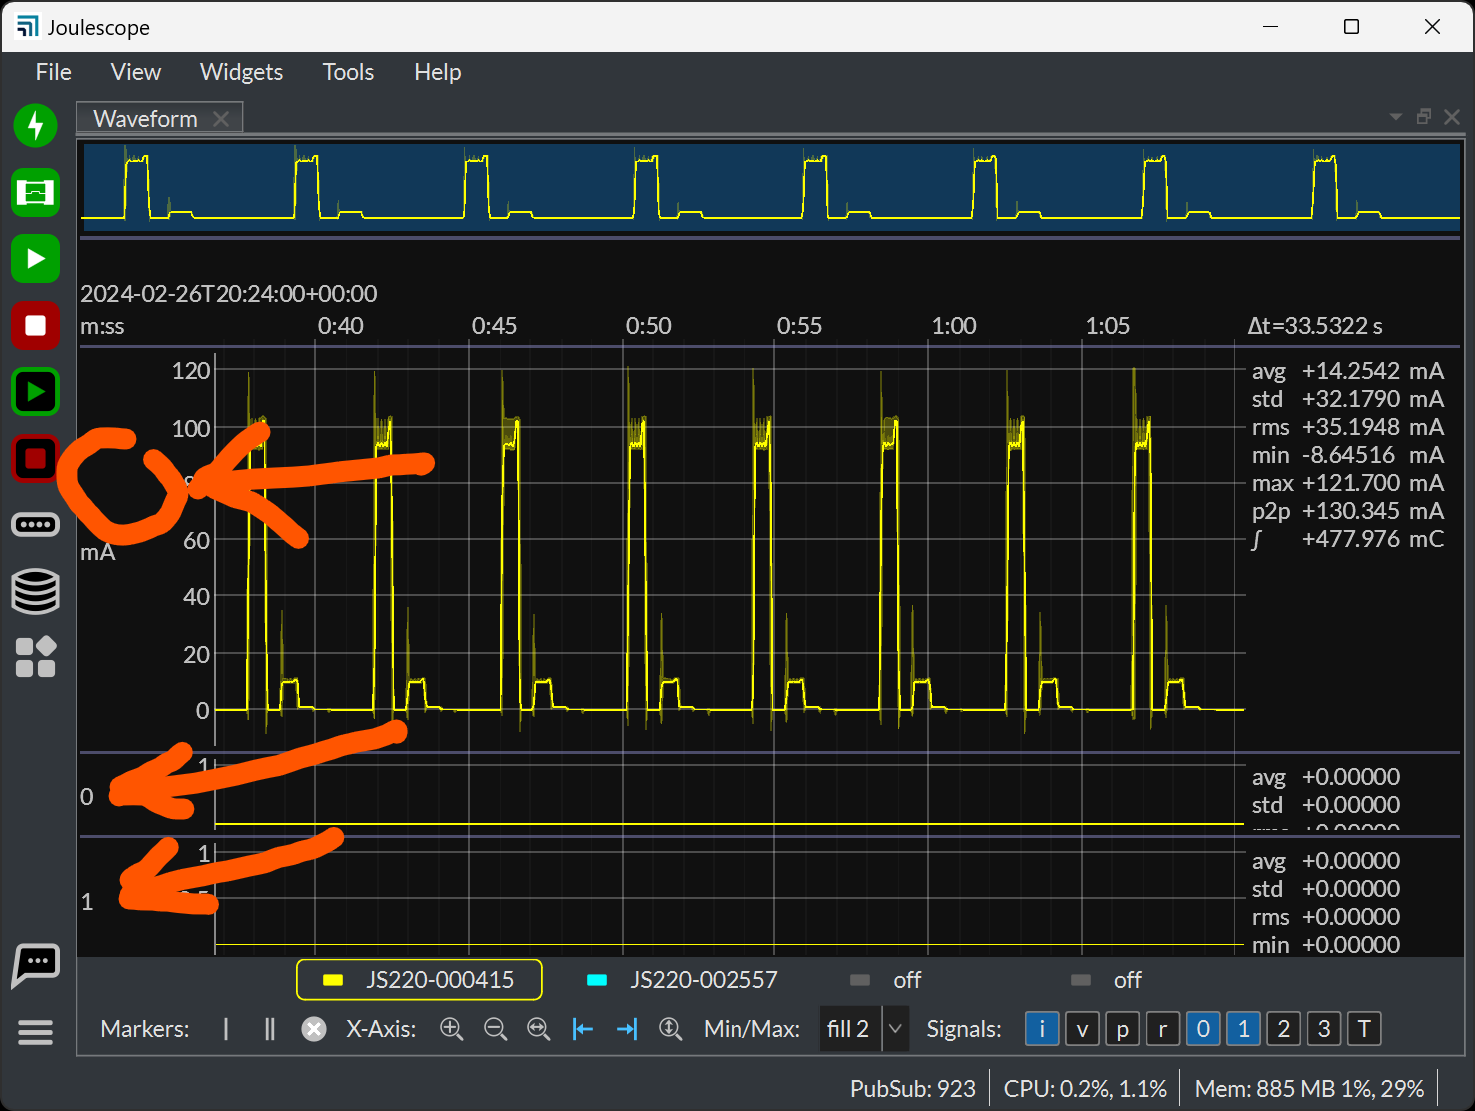
Actually I would like to add text to left of the units (‘mA’) in your top picture and I’d like to be able to change the text for the GPIO lines that are currently ‘0’, ‘1’, ‘2’, ‘3’
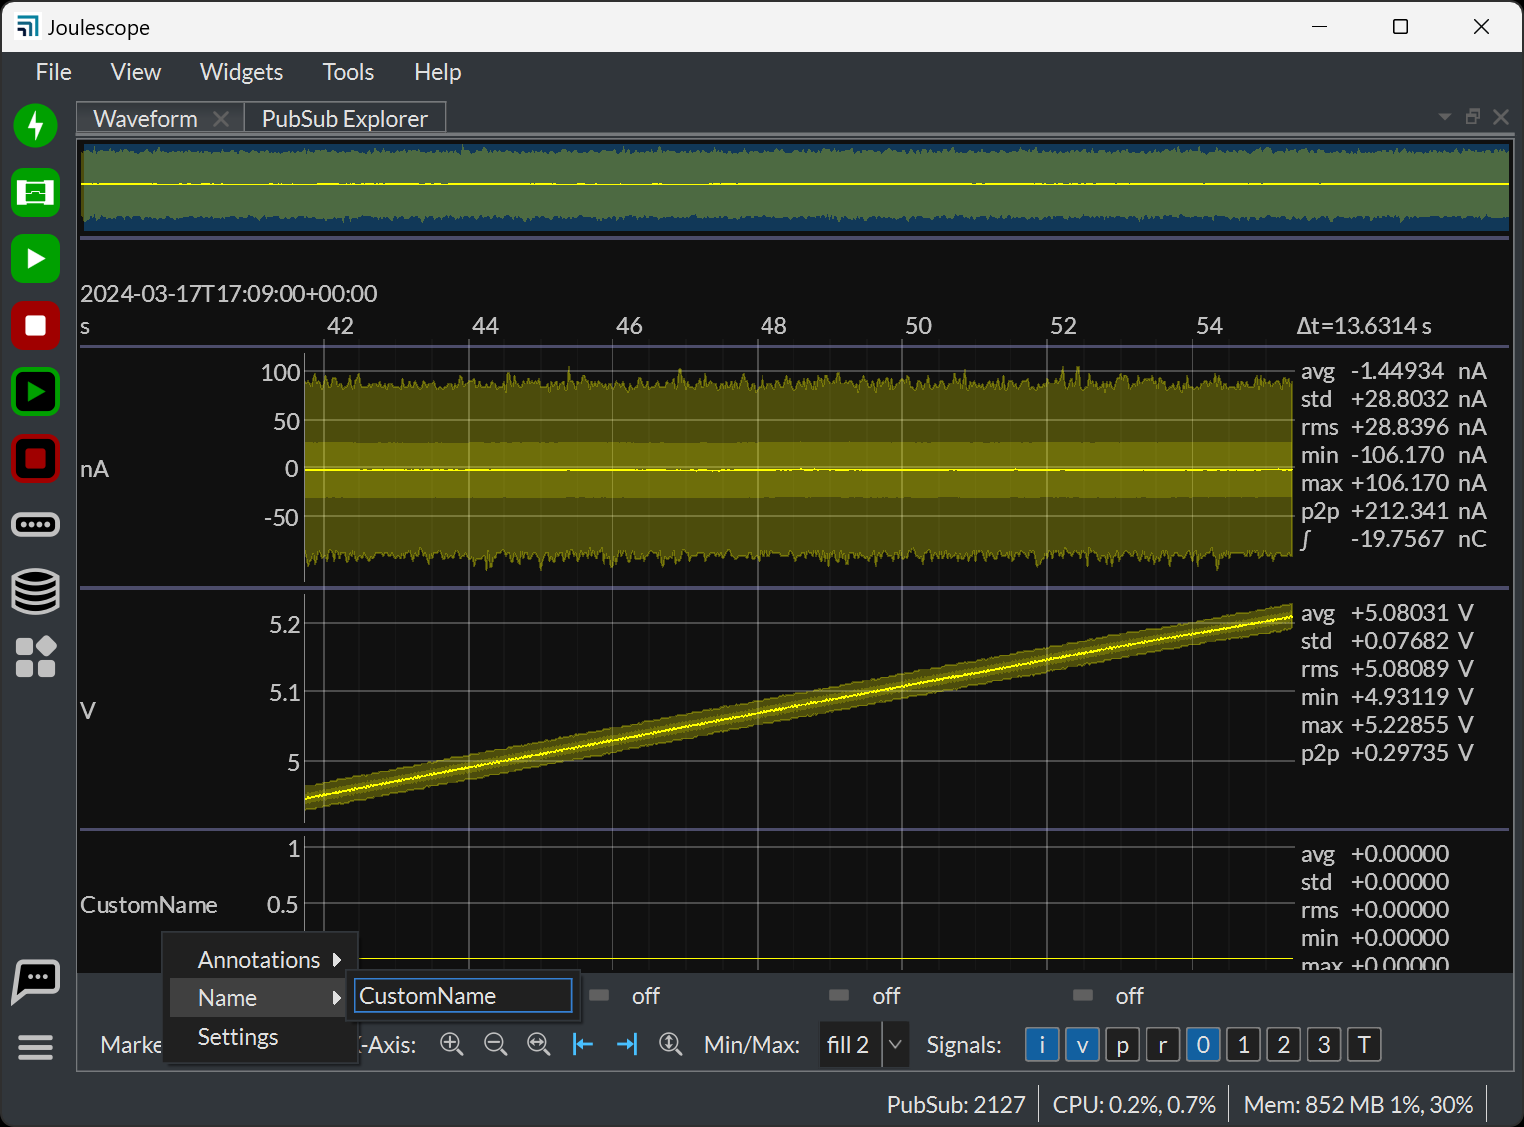
Thanks for the clarification, @maynarde. The existing Waveform widget is pretty terse with the plot descriptions. I now understand that you want to change the plot label on the left, like this:
In addition to units, the UI probably could display the plot name for Current, Voltage, and Power. The units could be on a second line.
We could add an option to the context menu when you right-click on the y-axis area of the plot. This new option would allow you to set the desired name for that plot. We would also need to rescale the plot dimensions to fit the longest text name in the y-axis area.
Would this work for you?
you’ve understood my request perfectly. Thank you!
Your solution would work great for me. I might suggest that rather than worrying about the text setting the size of the y-axis area, just cut the text off. Your users should be able to figure out how to resize the windows for their needs.
Cheers!
1 Like
Great! I have added issue #255 to GitHub.
We are in the process of the final acceptance testing for our next release, 1.0.56. This feature should be pretty quick to implement. We will plan to have this in the following release.