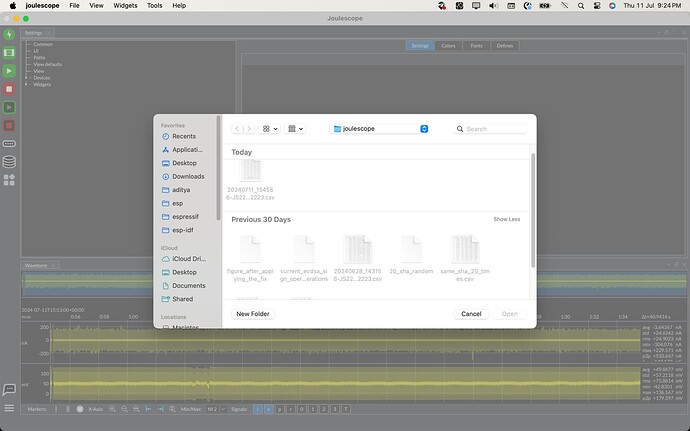
I have stored some previous waveform in the CSV format through the joulescope application.
For some reason I am unable to re-open the waveform with Joulescope application.
It is not allowing me to open any of the previously saved waveforms. I can confirm that those waveforms have been stored by Joulescope application only and they are unchanged.
Hi @aditya_patwardhan and welcome to the Joulescope forum!
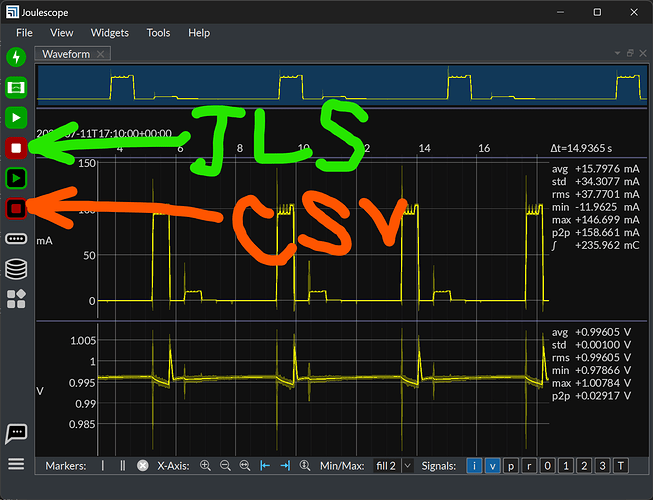
If I understand correctly, you pressed the Statistics recording button to record a CSV file. The Joulescope UI has never supported loading this file as a waveform. It is used for external analysis.
If you want to record a waveform, press the Signal sample recording button to record a JLS file. You can later load these files in the Joulescope UI. If you want a slower sample rate, you can select it using the Device control widget.
Does this explain what you observe?
Matt,
may I suggest using two different icons for those buttons that more clearly reflect what they do? I know when you hover over them, is is apparent, but if you just click on them… not so much. Also, it doesn’t help that the title of both buttons’ dialog box that pops up says ‘Configure signal recording’.
Thanks @milberty for replying,
Ohh, okay. Is it possible to convert the CSV file that I have into a JLS file?
And could you please tell me the use case for this CSV file? would any external tool allow me to analyse the timing and waveform from the data?
I don’t know what an icon for signal recording vs an icon for statistics recording should look like. We are using the old-school tape recorder “record” button icon, which has become “standard” for audio/video transport controls.
Do you have any suggestions for what would be more meaningful?
Yeah, this looks like a copy-paste error. Will fix. The dialog box titles should be “Configure signal recording” and “Configure statistics recording”.
You can use the pyjls package to put any 1-D signal into a JLS file. However, we don’t have any tools to automate this. We could potentially add support to the Joulescope UI to load and display statistics CSV files. To date, we have not seen any reason to add this feature.
How difficult is it to just recapture the data?
CSV is one of the lowest-common-denominator file formats for data. It is supported by almost all data analysis applications and languages. Some examples include:
I can see why you want to keep the ‘record/play’ icons for each, so maybe just a labeling would help people from making a mistake?
The Joulescope UI now supports multiple languages. Getting text like this to display across all languages will be very problematic. German will be longer, Chinese needs to be wider. I also have an opinion that icons should stand on their one without supporting text. I am not tied to the play/pause/record transport control iconography, but I also don’t really know anything better.
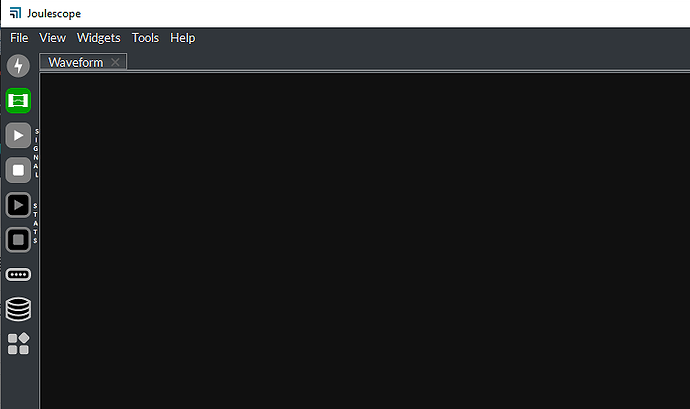
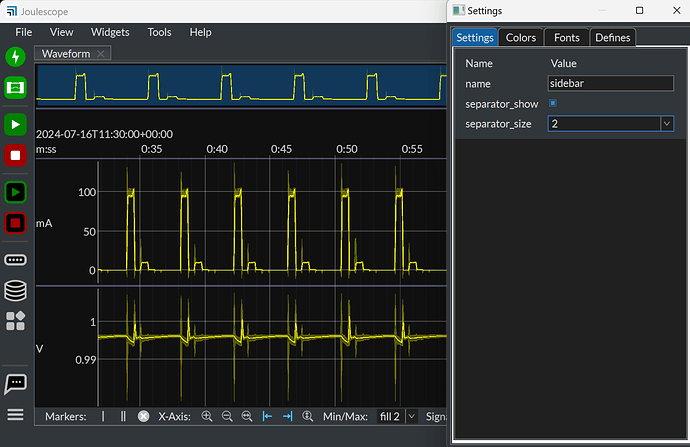
I could at least try to separate things. I tried adding a horizontal separator between button groups:
I am not sure this really helps…
I could also try different colors. Right now, the two types are separated by color fill or background fill. I do like the simple color palette, so I am reluctant to introduce two more colors on the sidebar, like blue and yellow.
Any opinions?
Thanks for your consideration of this, Matt. One of the many things I admire about you, in addition to being a brilliant engineer, is that you listen and are concerned with all of your customers’ concerns or suggestions.
I was wondering if you were multi-language now, but I didn’t find a setting (granted I didn’t look too hard), so completely understandable that you would want to avoid text (especially in that location).
All I can suggest is maybe a waveform-looking icon for signals, and perhaps a bar chart to reflect statistics. Maybe take a look at a Google image search for statistics icons to see if there is something that looks intuitive to you. I guess it’s not as big a deal once you fix the dialog box titles. My only concern about it is someone pressing a record button to do some lengthy recording, then realizing after the fact they pressed the wrong one (probably a mistake you will only make once).
I confess I haven’t used my Joulescope for quite some time, having decided to retire before my time (I even had to download the latest version to see what things currently look like), so my opinion isn’t that important anymore. If you can’t find an alternative to your liking, just leave things the way they are.
BTW, I actually do think the separation bars are an improvement.
Thanks @mliberty for your suggestions
-
I will try to recapture the data. I think I should be able to do it.
-
Yes, I am aware of csv format. I thought if there was any readily available interface which consumes the csv data and gives output as a waveform similar to what Joulescope does. It appears there isn’t one.
I will recapture in JSL file.
Thanks for the quick revert and resolution.
Thanks @wired for your inputs
Great! If its not too time consuming, this is likely the easiest approach.
Many tools exist to plot CSV data. While it seems many people still prefer Excel, I like Python. Here is one approach using Pandas that will work on your CSV file, assuming you recorded with relative time (the default).
- Download and install Python.
- At the command line, install depedencies:
pip install pandas numpy matplotlib - Run python:
python, but you may needpython3on some macOS & Linux machines. - Copy the following, replacing
path/to/my.csvwith your desired filename:
import pandas as pd
from matplotlib import pyplot as plt
df = pd.read_csv('path/to/my.csv')
plt.plot(df['#time'], df.current)
plt.show()
Hi @wired
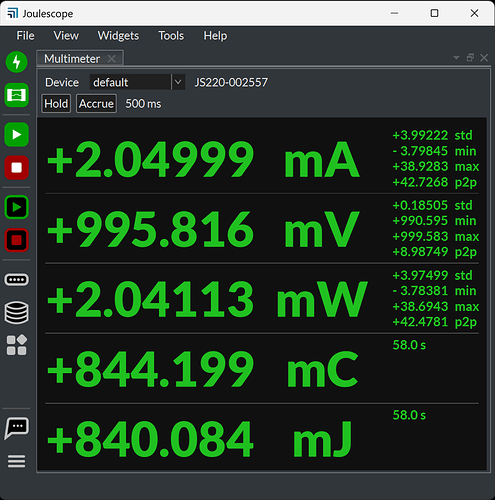
Thanks! I did play with The Noun Project and ChatGPT trying to find something I liked. I am not really happy with this, but here is where I left it:
I will leave this as a project for a future day.
I added the sidebar separators which are growing on me. I also added settings to hide them and change their size because 5% of Joulescope UI users will inevitably hate them ![]()
Thanks for downloading the latest Joulescope UI and playing around to provide feedback!
