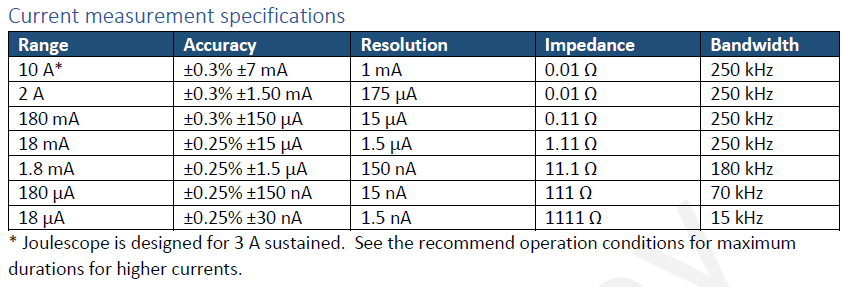
I’ve started testing a very low powered module with state transitions from sub-uA to mA range with pulse durations of ~150us. With auto-ranging, I see that I can get accurate current measurements during the low powered states. However, when the pulse is consuming mA range, the measurements look like it’s not able to select the correct rsense range? If I force to 18mA range, then I can see the expected profile.
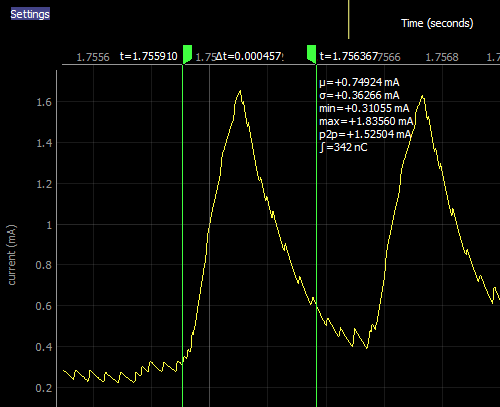
I think that you are observing the effect of the system bandwidth (not Joulescope’s measurement bandwith). The system bandwidth is limited to the RC filter formed by Joulescope’s shunt resistor and your target’s bypass capacitance. The first picture seems to show the exponential rise then exponential decay (sawtooth waveform) that I would expect for a bandwidth-limited system with a roughly square wave change in current load. In the 18 mA range, your Joulescope uses a 1.11 Ω shunt resistor, and the system bandwidth is 10x greater than the 1.8 mA range. In the 1.8 mA range, your Joulescope uses a 11.11 Ω shunt resistor. Let’s see if I can estimate your target capacitance
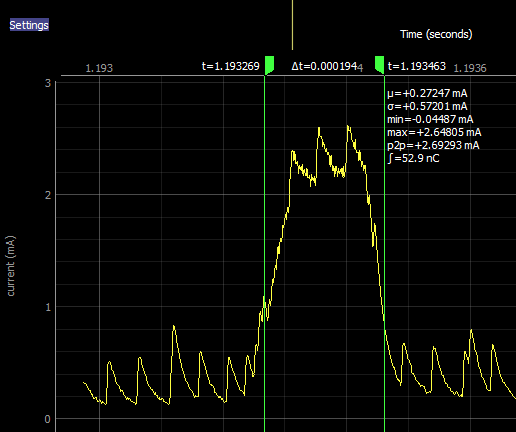
Given figure 2, I would estimate the “on” time at about 150 µs with an average “on” load of 2.25 mA and an “off” load of approximately 0.3 mA. In figure 1, your system reaches a max of 1.6 mA. So, we have the RC charging equation:
I(t) = Ion - (Ion - Ioff) e ^ (-t / tau)
1.6 mA = 2.25 mA - (2.25 mA - 0.3 mA) e ^ (- 150 µs / tau)
0.33 = e ^ (- 150 µs / tau)
-1.1 = -150 µs / tau
tau = 0.000136 s
Now:
tau = R C = 11.11 Ω * C = 0.000136 s
C = 12 µF
Is this on the right order of magnitude of what you expect? With these currents and durations, your Joulescope appears to never leave the 1.8 mA range in auto-ranging. If you want to post a JLS file between 0.2 and 0.5 seconds in duration which includes the figure 1 pulse, I can confirm.
Although the waveform is different between auto and 18 mA, they should yield the same total charge / energy over the long-term for the same conditions. If you see differently, let me know!
Ahh… thanks for the refreshing my ee101 . You’re in the right order of magnitude (~20uF). My discharge current is too slow relative to the pulse duration of 150us. Even with 1uF, I’m still looking at having to wait ~13us before the current would exceed 1.8mA. Does your scope switch sense impedance immediately after the 1st sampling value exceeds a given threshold? Could I potentially reduce the threshold to make it more aggressive to switch to 18mA range earlier for example? Or is that hardcoded in the FW?
I have the whole .jls file, but it’s pretty large. How can I just give you a snippet based on time window? The “recording” python script looks like it only dumps to csv or npy file.
The Joulescope autoranging uses a combination of dedicated analog hardware and digitized sample values in the FPGA. The analog hardware is fast but the thresholds are fixed. The FPGA thresholds on the digitized samples are slower, and have a latency of about 4 samples (2 µs). The FPGA thresholds are programmable as of firmware 0.5.0, but they are computed in the Joulescope microcontroller firmware based upon the per-device calibration. I don’t have a quick way to change this.
Are these waveforms in the figures above representative of your full device behavior? Right now, the Joulescope is likely staying in the 1.8 mA range the entire time. If so, then even adjusting these thresholds would just keep Joulescope in the 18 mA range the entire time, which you can already do manually. The downside to using the 18 mA range rather than the 1.8 mA range is reduced resolution (increased noise floor) and increased offset error.
You can also try manually setting the 180 mA range to give you a higher-bandwidth view of your current waveform. The offset error will increase another 10x, but the waveform shape will have 10x bandwidth and resolution is still an acceptable 15 µA. The 180 mA range uses a 0.11 Ω shunt resistor. With 20 µF load capacitance, the system bandwidth (not Joulescope’s measurement bandwidth) is still the limiting factor:
I need to do a better job explaining expected system bandwidth, not just Joulescope’s measurement bandwidth. In practice, all current ranges but the 10A and 2A ranges are often limited by system bandwidth.
Here is how you can export a smaller snippet from your JLS file:
Start the Joulescope UI
Open the JLS file: File → Open
Navigate to the region of interest
Place Dual Markers: Right-click on the x-axis (time in seconds), click Annotations → Dual Markers
Left-click on the left marker, move to the starting location, left-click again to drop.
Left-click on the right marker, move to the starting location, left-click again to drop.
Right-click on either the left or right marker, click Export Data.
Note that the JLS file format is currently truncated to a multiple of 0.2 seconds (which will eventually be fixed). The total duration should be either just over 0.2 seconds or just over 0.4 seconds to post accurately to this forum due to the forum file size limit.
Ah. No need. I just wanted to know if there was already such a way.
Yes,but I was hoping in my automation that I could leave to “auto” range to save one capture for multiple states. I also need the resolution down to 1uA range during other times not shown in capture. I can always take different captures with “auto” and “18mA” to get the states I want.
Here is the sample capture just to confirm it is indeed always in the 1.8mA range during that time. Auto_Sample.jls (1.5 MB)
Appreciate all the feedback and comment. It’s been really helpful.

 . You’re in the right order of magnitude (~20uF). My discharge current is too slow relative to the pulse duration of 150us. Even with 1uF, I’m still looking at having to wait ~13us before the current would exceed 1.8mA. Does your scope switch sense impedance immediately after the 1st sampling value exceeds a given threshold? Could I potentially reduce the threshold to make it more aggressive to switch to 18mA range earlier for example? Or is that hardcoded in the FW?