Accurate measurement of MCU's sleep current

Hi all,

I bought a JS220 a couple of weeks ago to measure the power consumption of a SoC.

Right now, I am interested in the power it consumes during deep sleep.

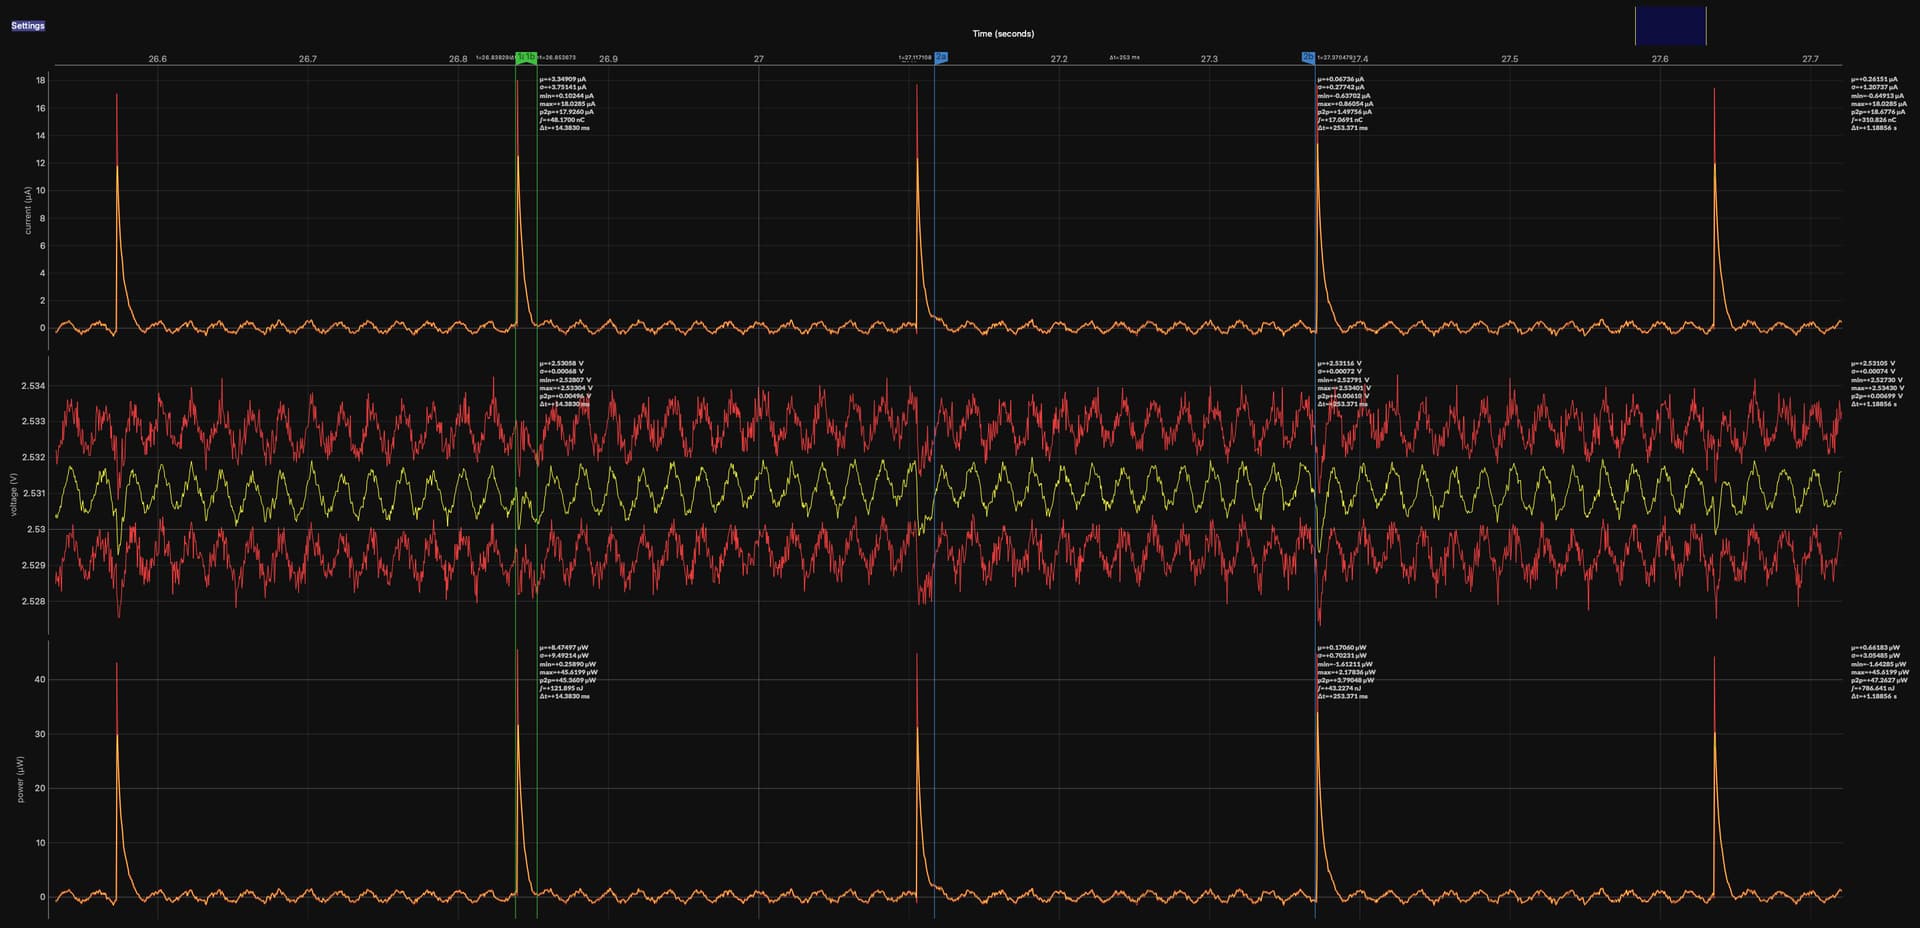
In the oscilloscope view I saw that my specific device in deep sleep only draws a very small current for most of the time with short peaks every ~275 ms (not quite sure yet what it does there).

So I started with a high (fixed) manual current range and lowered it to the lowest possible level to still capture the full height of the spikes. I ended up with the 18 mA range:

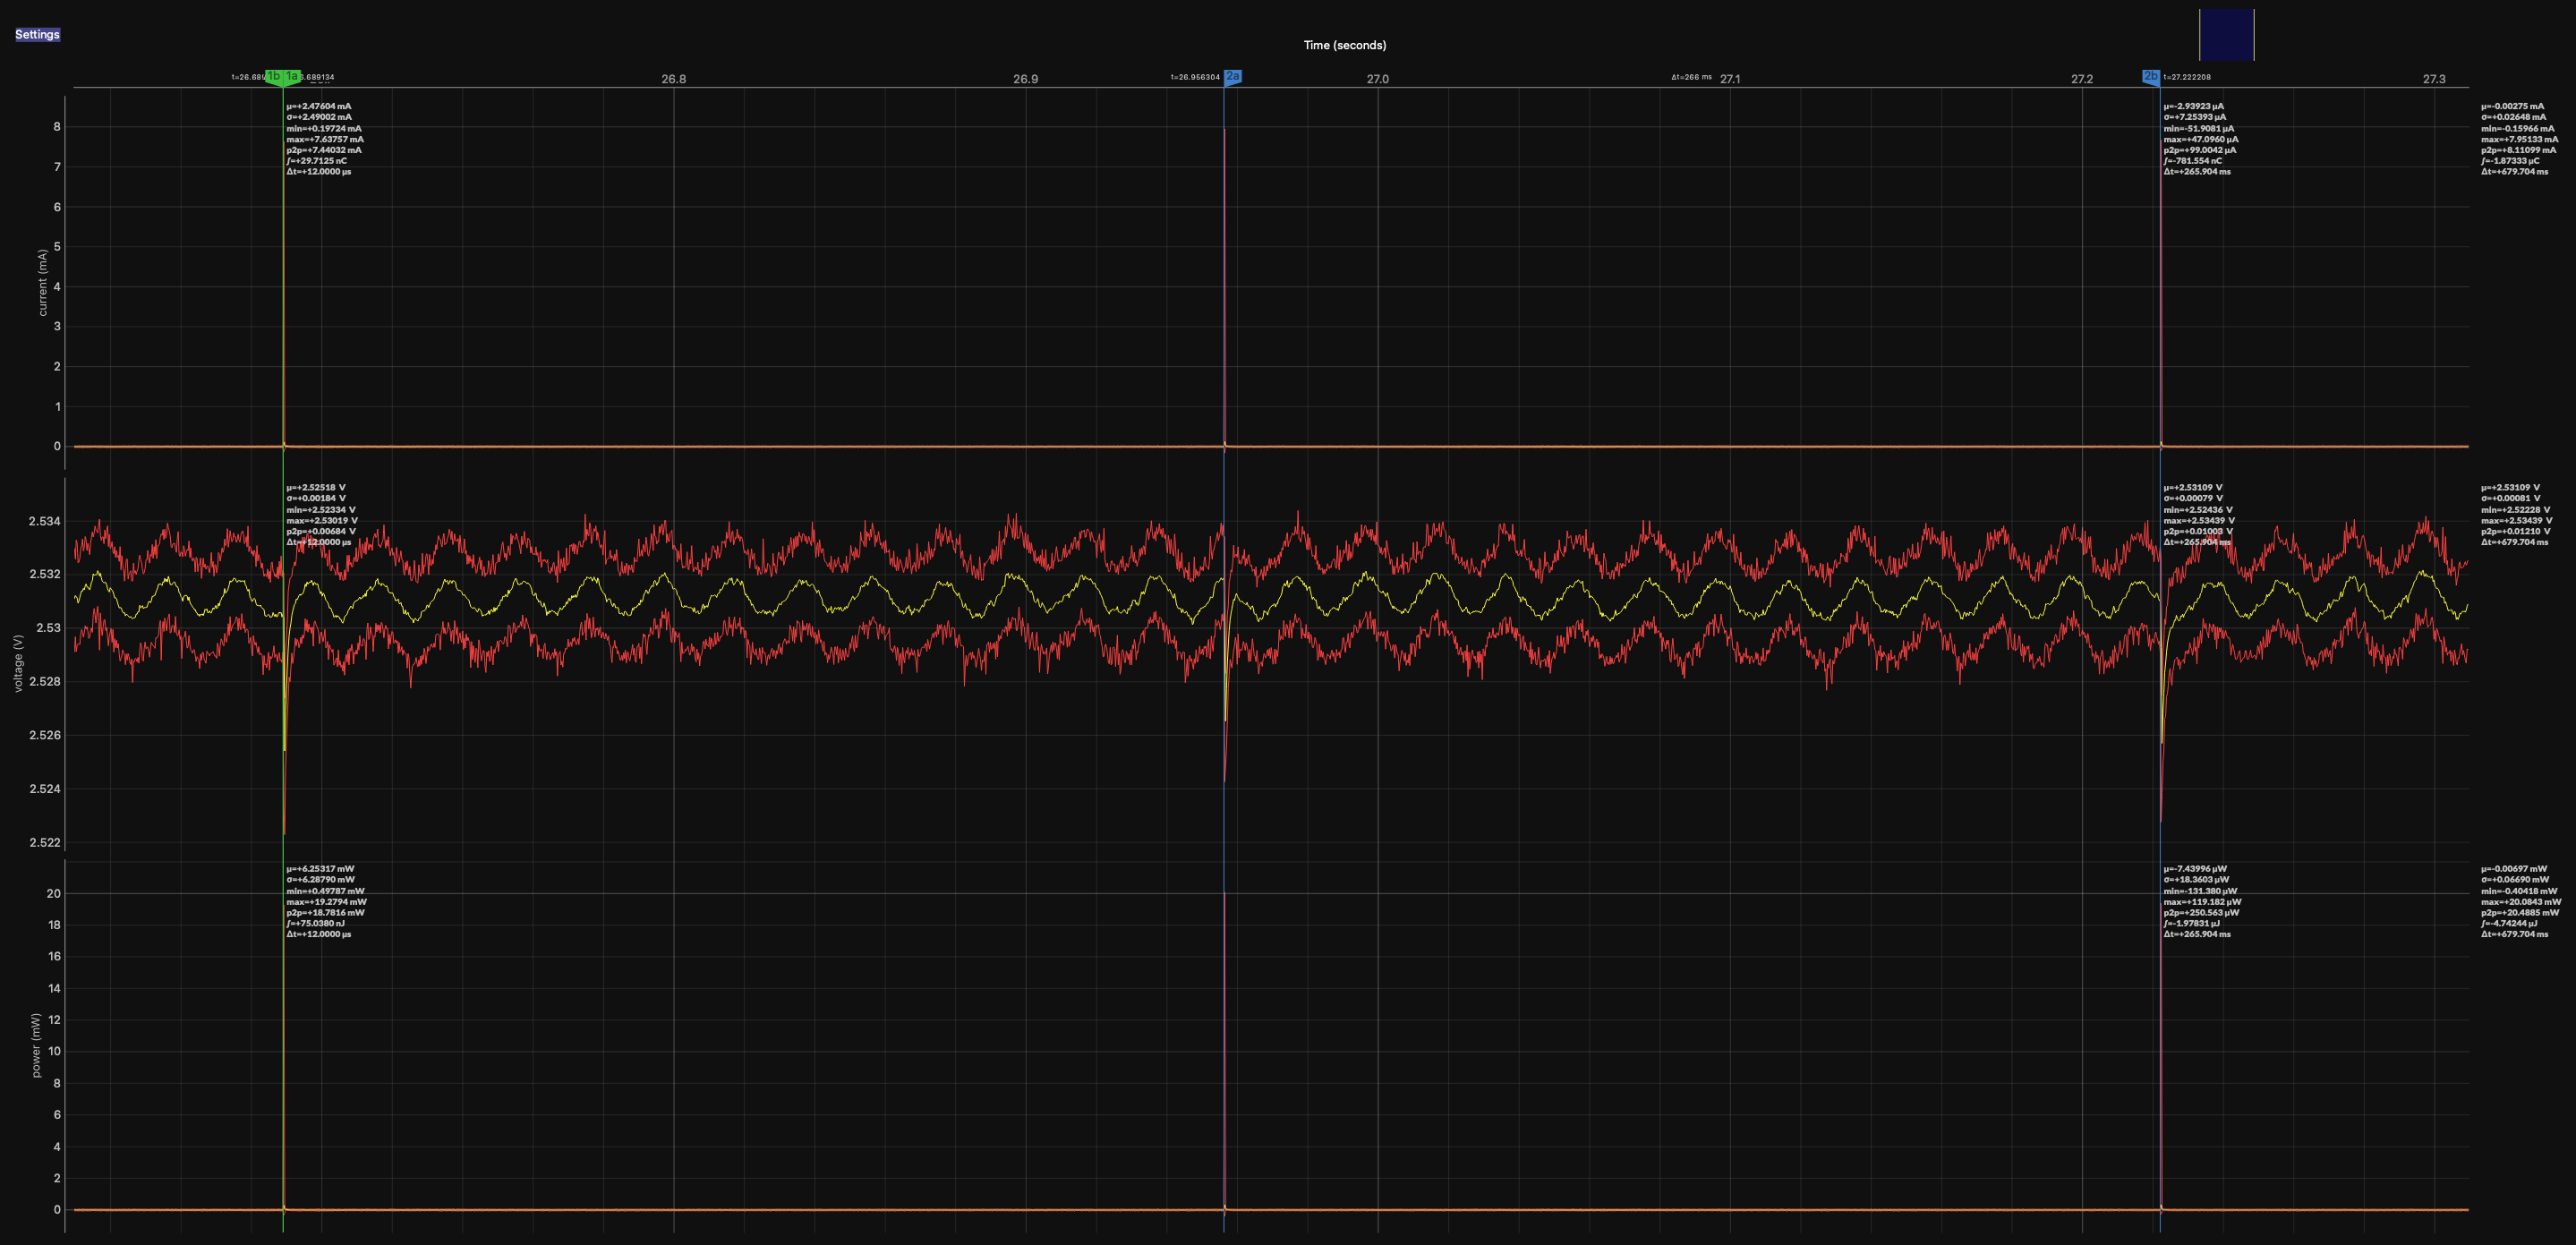
Cursors green: The peak only
Cursors blue: Between the peaks

What confuses me here is that the blue cursor measurement shows a negative average current, although the peaks show that the current should be flowing in “positive direction”.

772b1fe37a59f1da1da9c4cfc2819bb648f0a9eb_2_690x186

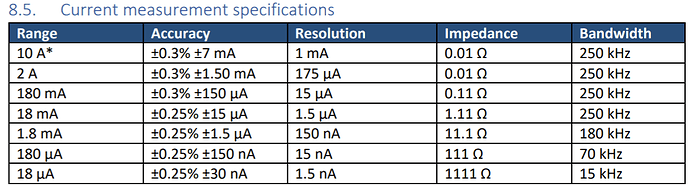
According to the JS220 datasheet, the offset error in the 18 mA range can be +/-15µA which could explain the negative value when trying to measure the very low current between the peaks. But in an other test I shorted the current posts on the device, measured in the 18 mA range and the result was an average current of ~+400 nA.

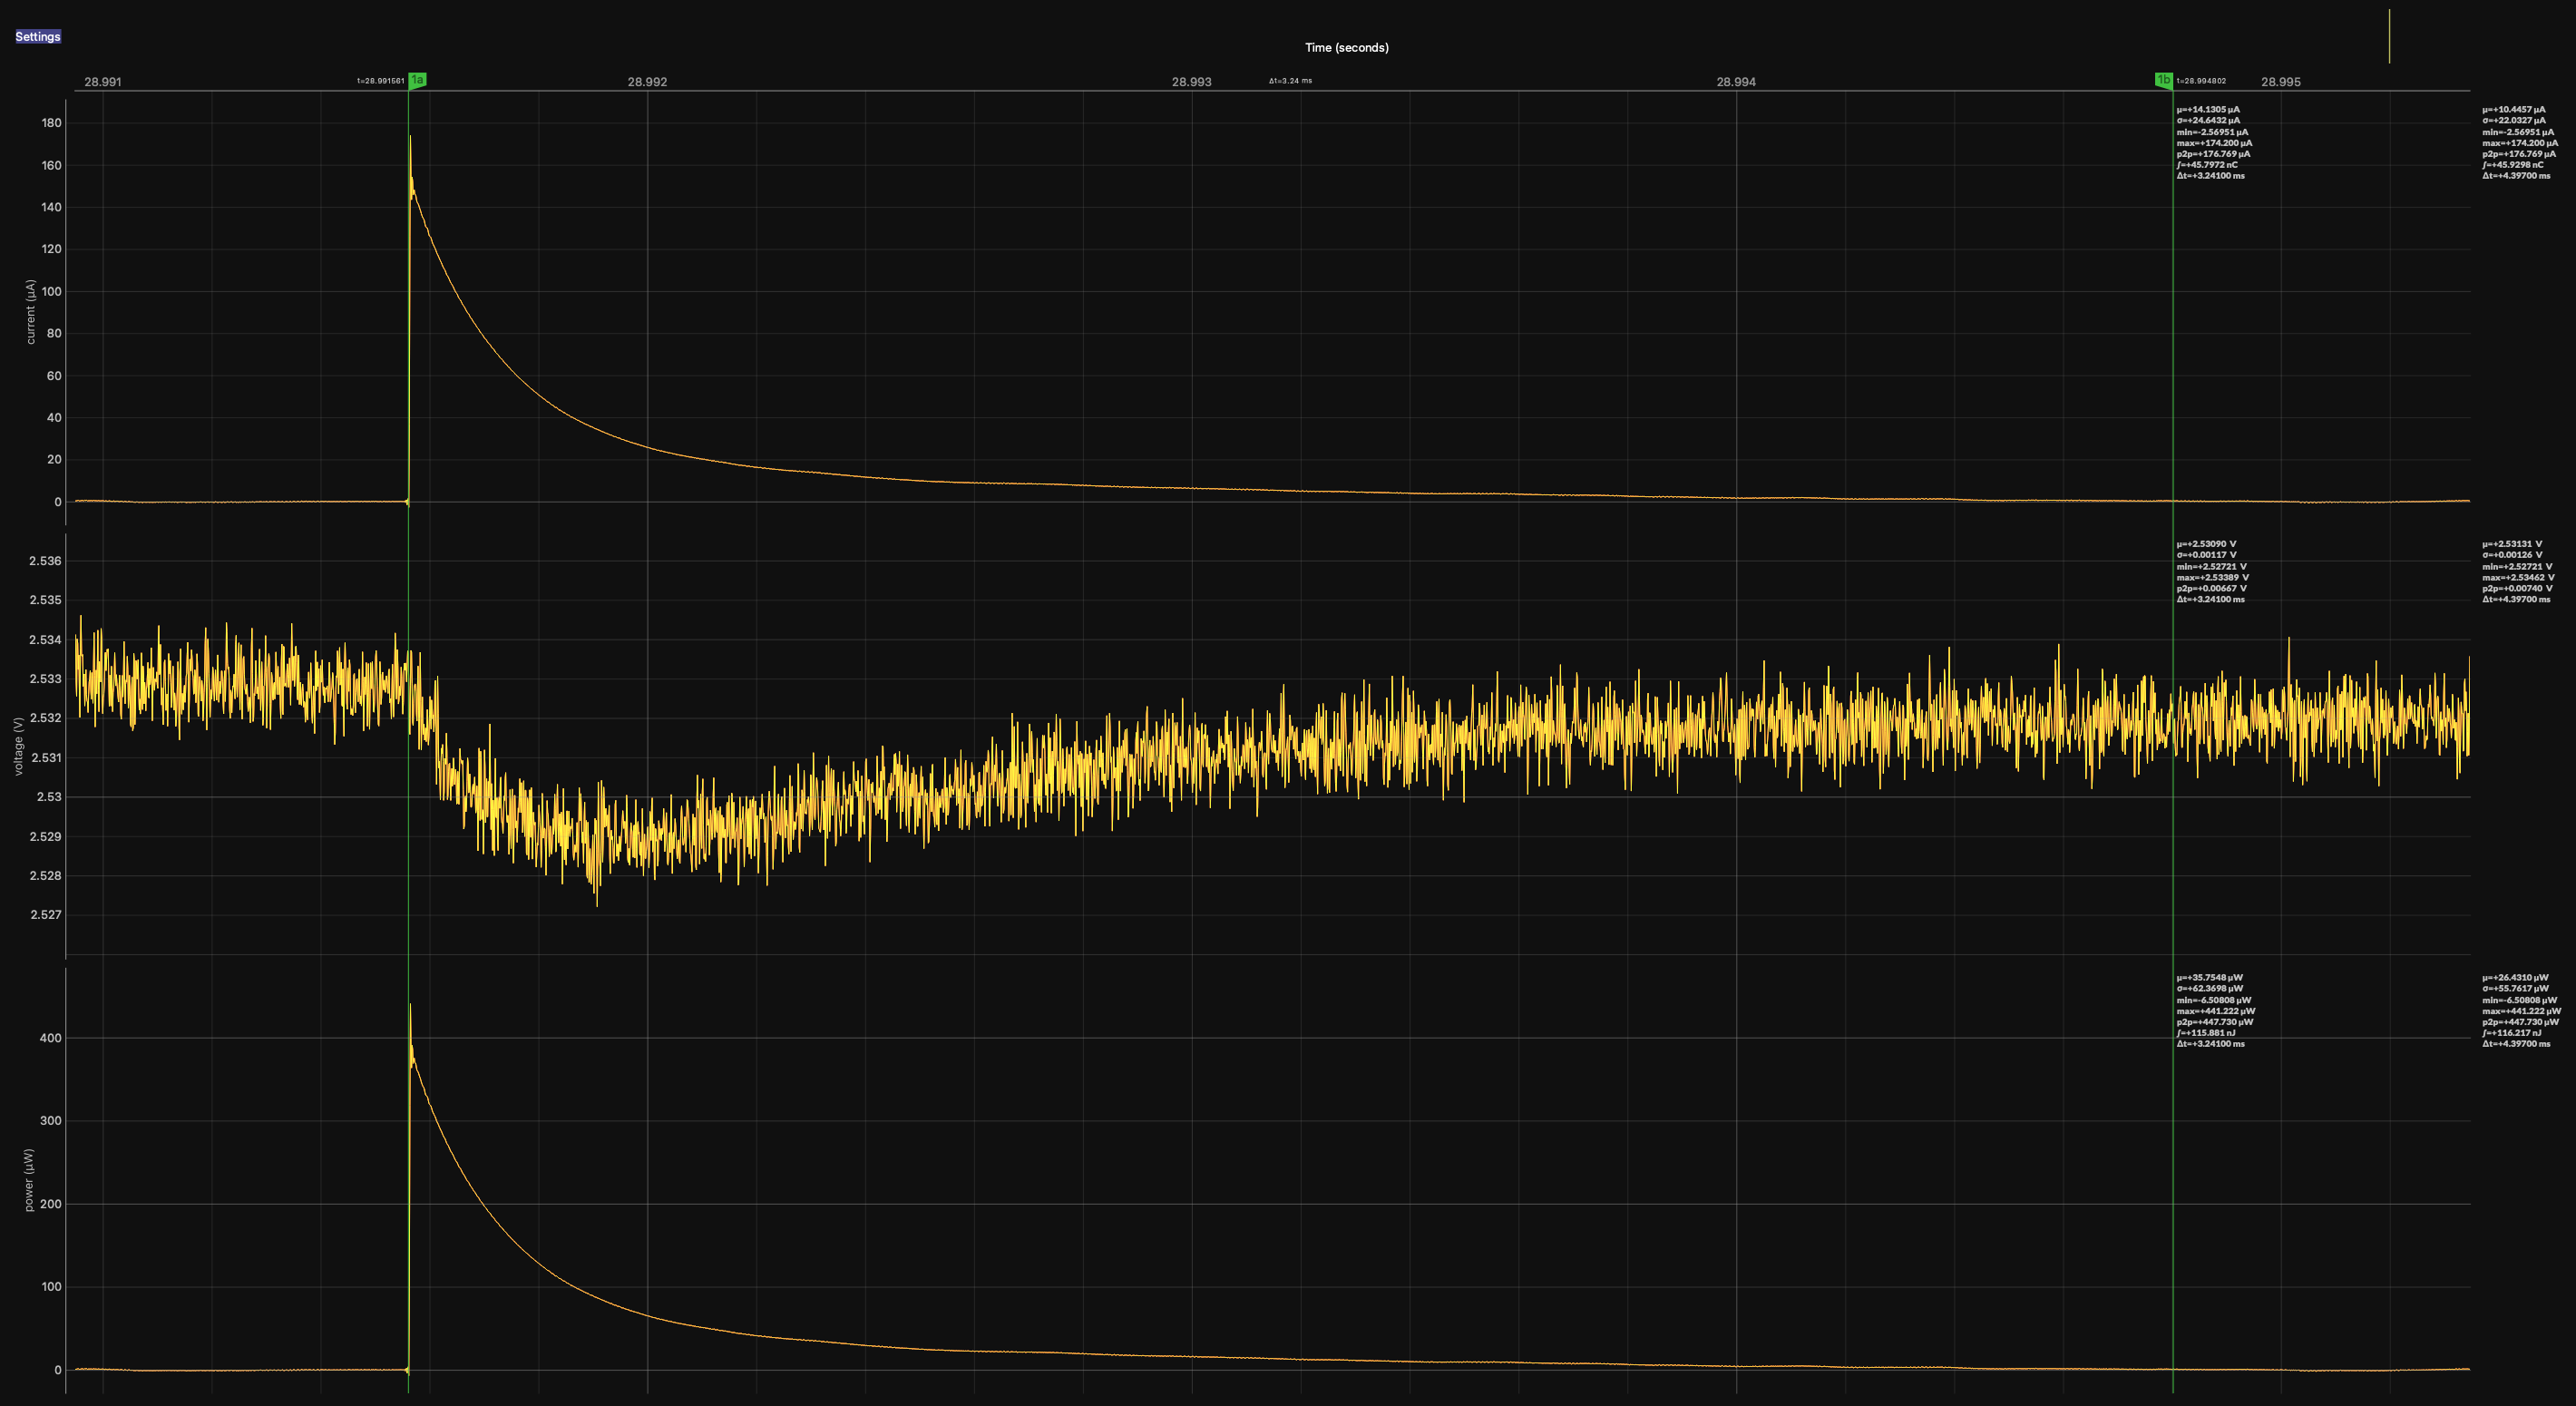
I then changed to auto range with the following result:

Here it seems to choose the 18 µA range (no difference if I change to manual 18µ), with no switching to higher ranges during the spikes. This makes them appear factor 1000 longer than they probably are but at least the blue measurement shows a positive mean value now.

Any explanations and/or suggestions how to measure the (average) SoC’s deep sleep current accurately?

Best regards

Hi @Josh and welcome to the Joulescope forum! Sounds like you are starting to put your new JS220 to good use!

I think that both captures measure the sleep current to the precision of the instrument in each configuration. To get the most accurate result, you normally want to use “auto”.

The other thing that is going on here is that changing the current range changes the shunt resistance which affects the system bandwidth. The 18 µA range will have lower system bandwidth than the 18 mA range.

The pulses look like very short-duration spikes followed by an RC decay. If you zoomed in closer, you can measure the RC time constant, τ. R is 1111 Ω (plus source, target, and cabling resistances) in the 18 µA range, so you can compute your target capacitance if you want.

When that short pulse occurs, it is filtered by the system bandwidth. The pulse is short enough that it never exceeds the 18 µA limit, so the JS220 never has to autorange. The total charge & energy is still correct, even with the filtering from the system bandwidth.

To get a higher time resolution view of the pulses, you can manually set the 18 mA range, as you did. However, the offset error in the 18 mA range is far larger than the current draw in the rest of the duration, which makes that measurement inaccurate relative to the signal of interest. You can manually “compensate” for this offset error by first measuring the offset in the 18 mA range with nothing connected to the JS220 inputs. You can then manually subtract this from your measurement.

The periodic event should normally consume the same amount of charge in both current ranges. Use dual markers to measure the pulse charge in the 18 mA range, which I think is 29.7 nC from dual marker 1 on the first plot. However, I would have to see it zoomed in more to know that you are just measuring the pulse and not picking up too much of the offset error.

Your second plot shows 48 nC (I think) for dual markers 1. Hopefully, if you tighten up the cursors in the 18 mA range, these values should be closer.

Hi Matt,

thank you very much for the quick reply!

I measured the offset “current” in the 18 mA range (open inputs) and it turned out to be on average -3.3 µA, which makes sense to me.

Comparing the charge during the spikes I measured 31.5 nC in the 18 mA range and 50 nC in the 18 µA range. With that I am not quite sure which one to trust more. Since, with the higher series resistor, it indeed looks like the current remains in the 18 µA range, the 50 nC are probably closer to the “truth”.

Another point: What about these +/- 500 nA oscillations around 0 in the 18 µA range? With open current inputs on the device they are in the +/- 20 nA range. As we are talking about nano amps here; maybe an EMI problem related to my measurement setup (I am using shortest possible cables already)?

How would you measure the average power consumption using the JS220 in my case? Using the auto/18µA range, dual cursors spanning the relevant time period and read the average power consumption like that?

I would appreciate your opinion.

Best regards,
Josh

I would think that the measurements should be closer than 31 nC and 50 nC. Can you post an image of the pulse captured in 18 mA zoomed all the way in with dual markers at the start and end?

Also, where are you measuring voltage for this setup?

Estimating from the first plot, I see ~12 cycles in 253 ms → 47 Hz. Are you in the EU or a place with 50 Hz mains power? It’s really easy to pick up mains power in your setup. In general, twist your wires together and keep the loop area as small as possible. You may find that running power to your board with twisted wires and then tapping current and voltage to the JS220 with separate twisted wire pairs may help. Disconnect all other instruments from your target device if possible to eliminate any possibility for ground loops. If you are able to share a picture, I am happy to take a look. Feel free to DM it to me if you don’t want to post publically.

Since these events are frequent enough, I would just capture for ~30 seconds and use that value. If you want to be more precise to ensure you capture full cycles, you can use dual markers as you mentioned.

1 Like

Hi Matt,

180 µA range:

18 mA range:

Well observed! This must be our 50 Hz, indeed. I think I can still try to optimize my cabling a bit and if I was even more serious, I would (/should) probably design a custom shielded test harness for the measurement.

Thanks!

Best, Josh

So it looks like the 18 µA and 180 µA range give reasonably close results: 50 nC and 46 nC. I am not sure how much variation you see from event to event.

Using the 180 µA plot, it looks like τ is very roughly 1 grid division = 200 µs. The JS220 uses a 111 Ω shunt resistor, so your target capacitance is roughly 200e-6/111 = 1.8 µF.

With the 18 mA range, the JS220 uses a 1.11 Ω shunt resistor with much higher bandwidth. τ is now approximately 1.11 * 1.8e-6 = 2 µs. If there is a lot of additional high-frequency content (which we wouldn’t see here), then the JS220’s front-end opamp’s voltage slew rate may not be able to track it. In this case, additional high-frequency content would result in a lower than actual measurement. Regardless, using the auto (18 µA) or 180 µA current ranges reduces the measurement bandwidth which improves accuracy.

Do you mean 18 mA and 180 µA range? But comparing them I see 30 nC and 46 nC, respectively :thinking:

Reducing the measurement bandwidth by selecting a smaller measurement range completely makes sense, though.

Best, Josh

I did mean 18 µA, which is really the Current Range set to auto as shown in the second plot in the original post. However, the value was actually 48 nC, not 50 nC as I said, which is even closer to the 46 nC measured in the 180 µA range.

I hope that this helps with your measurement and SoC work! If you have additional questions or issues, please don’t hesitate to post here or start a new thread.

Hi Matt,

I just realized, that it was me causing the confusion.

You asked for the 18 mA measurement zoomed in all the way to compare it to the measurement of the spike performed in the auto (18 µA) range:

I then sent the 18 mA plot as well as a 180 µA measurement (my bad).

However, if I understood you correctly, you thought, that the charge measurement in the 18 mA range should result in similar values as in the 18 µA range. Summarizing the results shown above:

18 mA range: 30 nC
180 µA range: 46 nC
18 µA range: 48 nC

So the µ-range measurements yield similar results but they are very different from the charge measured in the 18 mA range. Maybe with the small shunt in the 18 mA range, the spike is so short that undersampling causes the difference?

Best, Josh

Yes, but it’s really about the first opamp in the analog front end, not undersampling. We have an excellent analog anti-aliasing filter in the JS220 to prevent undersampling issues and aliasing. However, if the first-stage opamp cannot keep up due to bandwidth or slew rate, then it could distort the signal. This is still a hypothesis that needs more testing.

One way to test this out is to add an additional 10 µA or more of effective capacitance at the target.
Remember to derate capacitance for the working voltage. This reduces system bandwidth to align with the JS220’s measurement bandwidth. If my hypothesis is correct, then the 18 mA range measurement with this additional target capacitance should be closer to existing 46 nC and 48 nC measurements from the 180 µA and 18 µA ranges.