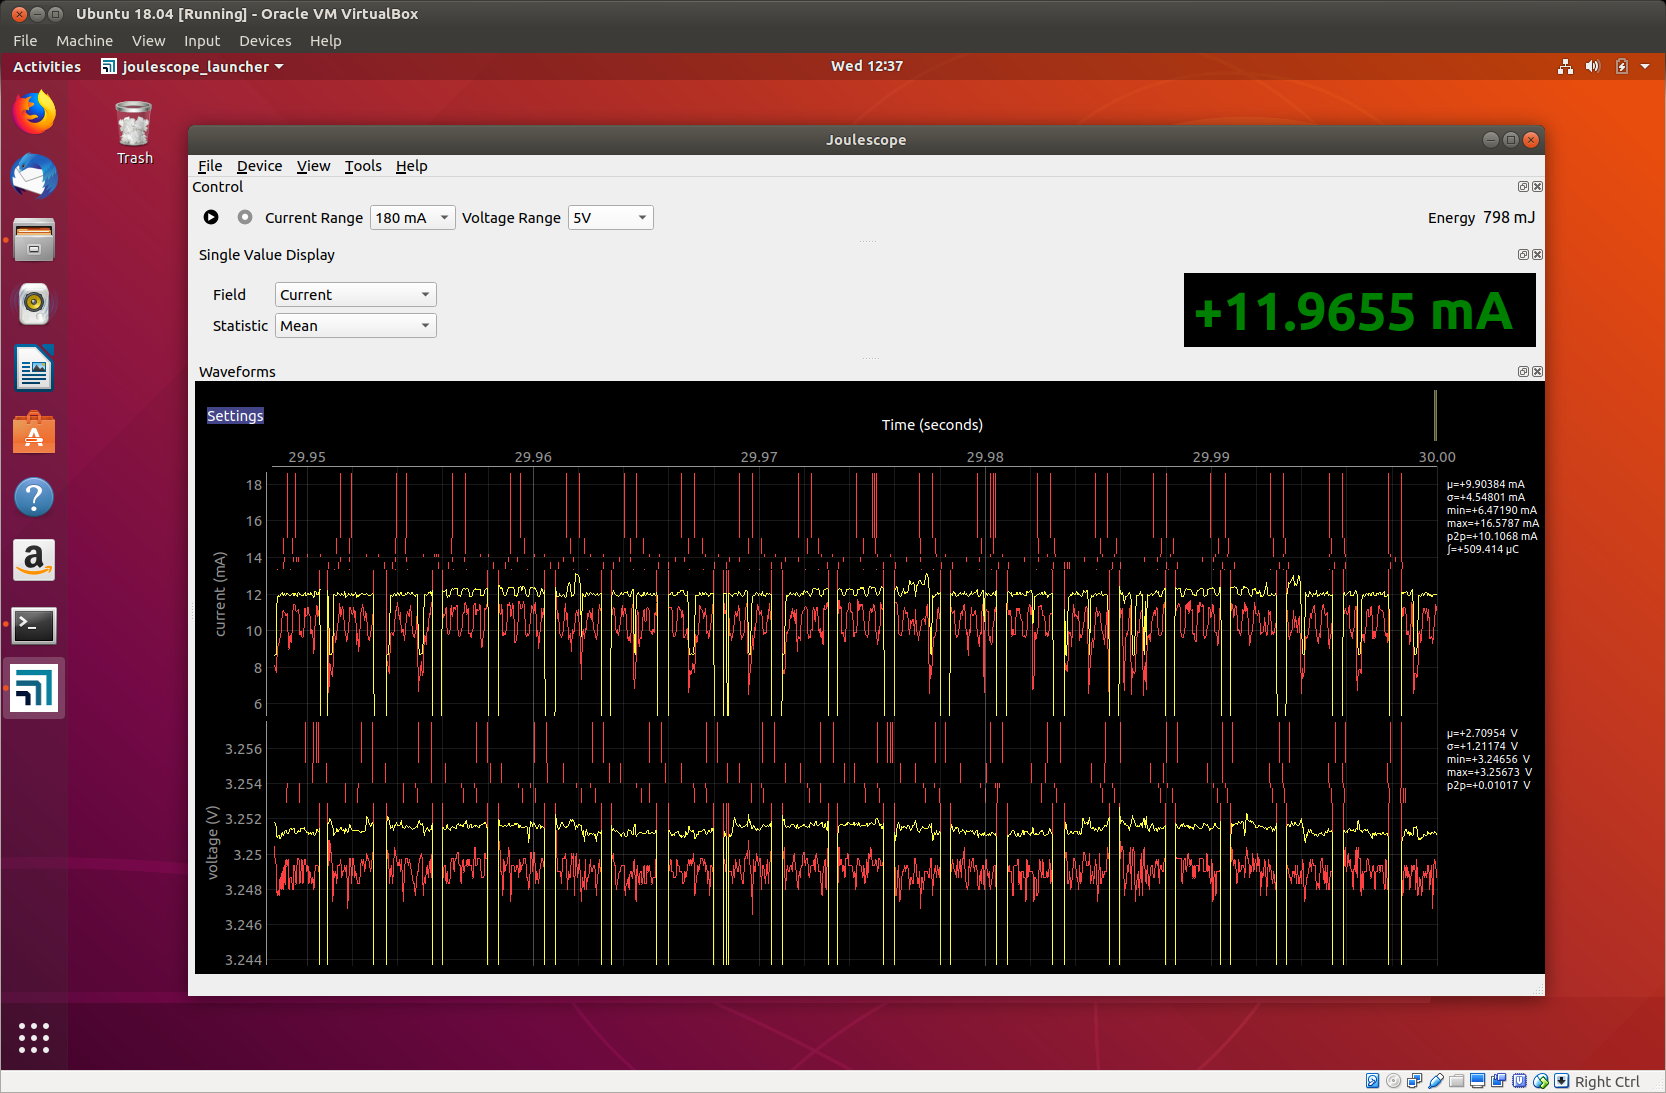
Attached is a screenshot from an actual device we’re testing with. It appears the graphing routines “wrap around” with some inputs, causing the trace to completely disappear. Because of this, some stray artifacts are left behind (see the top 1" or so of both the current and voltage graphs).
I’m measuring processor current here, so the change in current can be quite large, and quite sudden. The idle current for this processor should be around 0.5mA, while “full on” is around 7.5mA. The change (on->off or off->on) can happen in a few nS. Obviously, there are other current drains here (still looking for those!) that raise the floor to something like 8.6mA. In this mode the processor is running ~50% of the time. (8.6mA floor + 50% of 7mA is about the 11.9mA shown).
On a high note, the measured current matches very well with other test equipment we have, but Joulescope is so much easier to use!
2 Likes
Thanks @TimToombs for that screenshot and description. That behavior is not something that I have seen before. I have added it to the bug list, and I will do more testing on my Ubuntu 18.04 LTS machine to see if I can duplicate it. Although it can really reduce frame rate, you can try Preferences → Waveform → show_min_max → fill in the meantime. At the very least, the artifacts will be different 
I was about to say that those short glitches could be due to the 1 to 2 samples of Joulescope autoranging, but I see that you have it set to 180 mA fixed range.
I’m very happy to hear that you are finding Joulescope easy to use and useful! Thanks for taking the time to post your findings, and we’ll be working to address these types of issues.
Hi @TimToombs,
It’s been a while, but we finally have an explaination for this issue. When running the Joulescope UI in a VM, the virtualized USB driver does not keep up with the Joulescope data rate, which results in dropped samples. The 0.4 software you were using has no easy way to indicate dropped samples.
The 0.5.0 software displays a source indictor on the status bar that is normally a USB with a green background. If more than 0.1% of samples are dropped per 0.5 seconds, the USB indicator background turns red.
The vertical line artificts are caused by the software incorrectly interpretting the data around the sample drops. The values are float 32 max and min, which appear to not be handled nicely. This issue was just fixed in the development code branch, and will be in the upcoming 0.6.0 release.
Thanks Matt! I knew you’d figure it out.
-tim-