Missing data reported as zeros depending on zoom level

In a recent collection using two Joulescopes with 10kHz data logging (Win10 x64, UI v0.8.11), I discovered that my log files would show 0V and 0mA in a number of places. There appears to be no data saved during these periods. The statistics show minimums of 0, yet when I zoom in, the statistics are correct, and the missing data is connected by a straight line on the plot. This first image shows the 0 values when zooming in.

This second image is one more level of zoom in. Zeros in statistics are gone.

So, two questions:

  1. I have quite a few instances of missing data for ~4 second periods. Why? It happened in both Joulescope recordings at different times.

  2. Shouldn’t the missing data always have a linear interpolation of points between first and last recorded points surrounding missing data?

Entire file is attached:
20200422_122925.jls (2.3 MB)

Hi @wired,

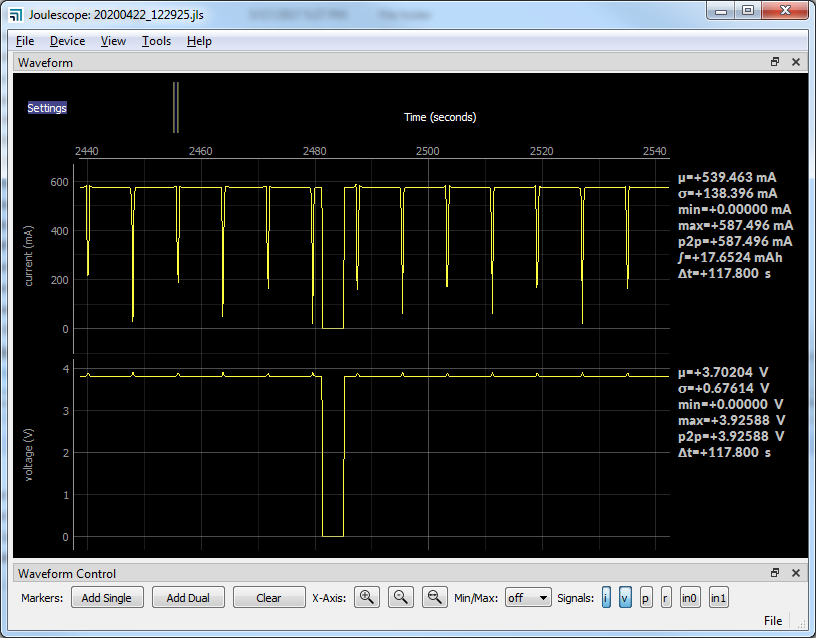
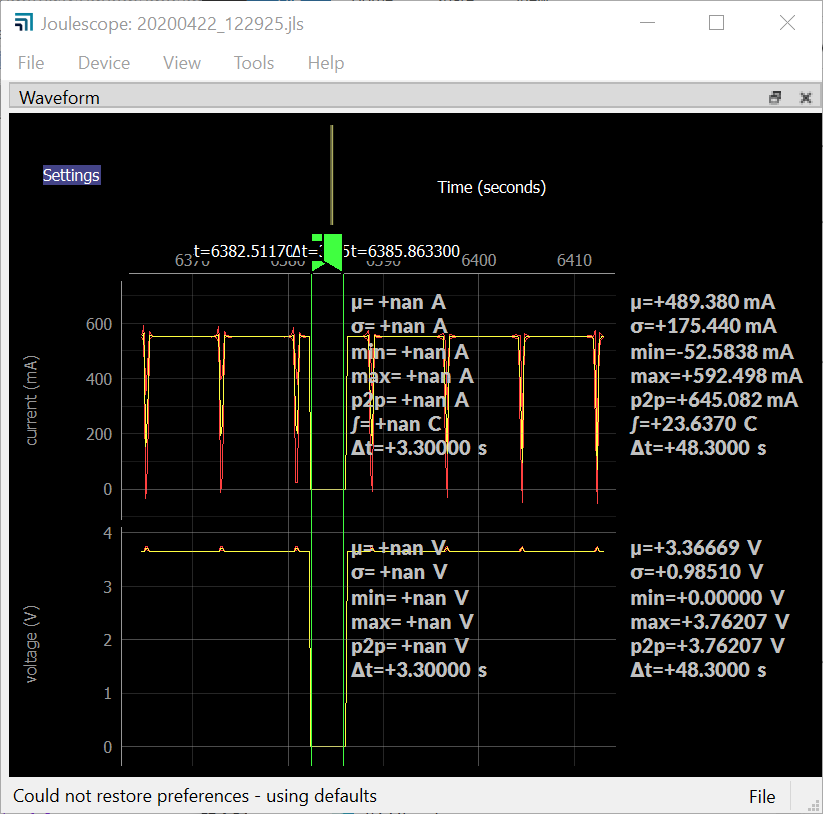
It appears that your computer is going off and doing something other than getting Joulescope data. Joulescope currently uses USB Bulk IN mode, which guarantees correctness but not timeliness. If your computer starts accessing other USB devices, such as a flash drive or decides to do something else than service the Joulescope process, then Joulescope data will be lost. I looked at one particular case where 3.3 seconds appears to be lost:

I also noticed that these captures are at 10 Hz, not 10 kHz.

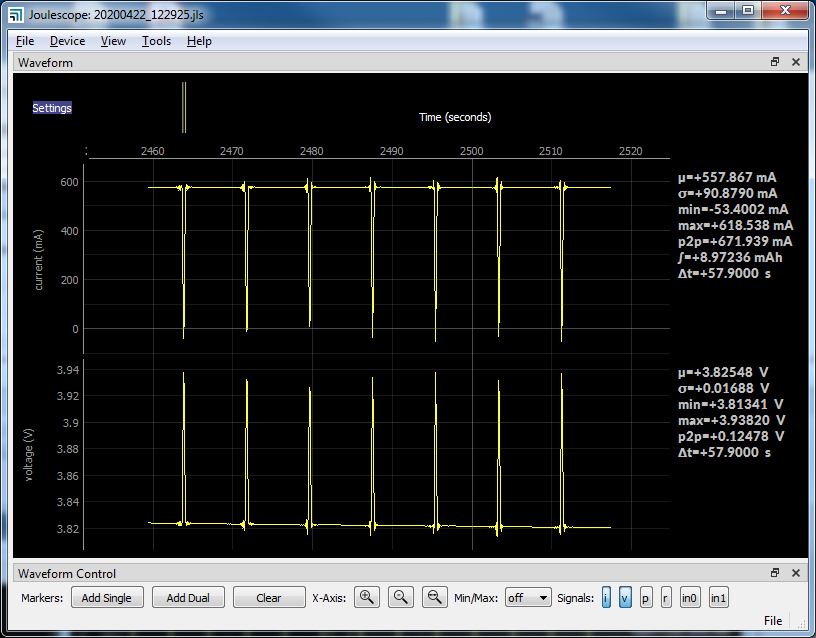
Here is the zoomed in view:

The difference in display is due to how the Joulescope UI displays the value. In the first image, the Joulescope UI displays a data reduction with mean/min/max. In the second image, the Joulescope UI is directly displaying the samples (no mean/min/max available). The reason for this display difference is historical. The statistics end up being the same with this segment ignored.

How much can this impact your measurements? I measure a segment from 5844 to 8247 seconds, which has 11 drops, or about 1 drop every 239 seconds. I measured drops to be about 3.5 seconds, or about 1.5%. This is a MUCH higher drop rate than I would expect,

For what its worth, these drops are captured in the Joulescope UI log file, and indicated by the USB text background at the bottom right changing from green to yellow or red. Drops in the log will say something like:

status YELLOW: dsample_id=nnn, d_sample_missing_count=nnn
status RED: dsample_id=nnn, d_sample_missing_count=nnn

So, the question is, why is your computer not servicing Joulescope’s USB Bulk IN data? What else is it doing? For the most reliable long-term captures, especially while using multiple Joulescopes, you should disable all other software on your computer. Modern computers actively manage power, which can cause issues. Here are some things to check:

  1. Ensure that all drivers are up to date, especially video, USB root hub, and networking.
  2. Ensure that your BIOS is up to date.
  3. Disable power management features known to cause issues:
    1. PCI Express Link state power management - off
    2. Fast startup - off
    3. Disable C-States in BIOS
  4. Ensure that your HDD is good
    1. In File Explorer, right-click drive, tools, Check
    2. Run: sfc /scannow
  5. Turn off Windows Update
  6. Consider disabling virus scanning, especially on the Joulescope recording output directory.

Googling for win10 freezes will bring up links like this and more.

Another option is to attempt to reduce the processing overhead required. What is your CPU utilization while capturing this data?

Supporting USB isochronous IN has been on my list for a long time. It will help prioritize Joulescope USB traffic in the presence of other USB devices. However, it will not fix the problem of your computer going out to lunch or taking too much CPU. My primary desktop still has a video driver issue that causes it to become unresponsive for about 5 seconds a few times a day. This single video driver issue impacts every other application, including Zoom, my Saleae Logic Pro 16, and Joulescope data collection.

Hi Matt,

I’m guessing that the data loss issue has to do with another USB device that I require to perform this particular test. I usually am not running them concurrently, but in this case I wanted to use the other device to log data wirelessly sent from my DUT during the test. It is unfortunate that the addition of a necessary piece of test equipment might be the cause of these dropouts. I did not see these dropouts when performing tests without the additional USB device.

As far as the zeros go, I realize they have a minimal effect on statistics, but I present these graphs in reports by doing a screen capture. If the reader sees a bunch of zero-current zero-voltage periods, it leads to obvious questions of whether that is really happening (and makes me wonder as well), except that I know that the DUT never actually went to 0V.

Is there some reason why the missing data is connected at zero value for some zoom levels, but looks normal again when zoomed in? I just don’t understand why this is necessary, as it leads one to question the data. There is no indication in the plots that this is missing data unless you put a single cursor on it and get NaNs in the statistics.

You are saying that the second image shows actual samples, which If that is the case shows that the minimum voltage is 3.64525V. If the previous image is a reduction of that, why is the minimum voltage shown as 0.00000V? I also find it interesting that the min voltage shows 0 like the graph does, but the min current does not.

Hi @wired

Your setup is likely either limited by (1) USB bandwidth or (2) CPU.

For 1, USB only has so much bandwidth. Your two Joulescopes take over 1/3 of the theoretical (not practical) USB 2 bandwidth. However, you can check if your PC has multiple USB root hubs. If so, you can relocated the Joulescopes to one root hub, all on their own. You can then connect everything else to a second root hub. Microsoft provides the USB View tool [see this article] which makes it much easier to see USB root hubs and their connected devices.

For 2, why not run the Joulescope data collection on a separate computer? I am a huge fan of Intel NUCs. They are small, relatively inexpensive, and are stock Intel designs. Other than the standard MS Windows and Intel BIOS issues, I have yet to have a driver issue. You could also go with an inexpensive laptop, but for your desired purpose, you would have to disable all power management.


As to the display differences, these are separate software paths.

All of these missing samples are represented as NaNs under the hood. The Joulescope UI has a long history of improving NaN handling. I think that the “right” behavior for the waveform widget is to ignore NaN data but display vertical bars to indicate the missing data. However, the Joulescope sample drop rate is normally so low, that this has not been a priority. I recommend that you address the actual issue (1) or (2) since this many dropped samples are bad.

Hello Matt,

Thank you for your reply. However, I believe there is more to discuss here, as I do not accept your reply as a solution.

So when will we get the ‘right behavior’ for NaNs? I’m not seeing vertical bars, and I’m not seeing ‘connect the dots between the missing points’ (which would be my preference, and in a different color or point style). I’m seeing a return to zero displayed during the NAN period that is also is apparently counted as a true zero if you look at the min voltage on the right side of the first image. Also, I don’t just see this effect on the plots at one zoom level, I see it at multiple zoom levels.

I totally understand that a device that relies on the Windows OS might get USB dropouts. Your device is inexpensive compared to a logging device with an embedded RTOS for a reason. The hardware you have designed is fantastic and very useful. However, I DO NOT accept the way that dropouts are represented in a plot and its corresponding statistics to be an acceptable solution. Energy is not the only important parameter here. Displayed max and min voltages and current are just as important, as is the way the plots are presented to the user. I will be happy to post more images at different zoom levels to make it more clear how confusing the displayed plots can be in the event of dropouts. A battery charge or discharge curve should not display artifacts that aren’t really there, especially with no indication that they are artifacts.

As you have aptly pointed out, there are numerous reasons why the Joulescope can lose data on a Windows platform. Because one can never know if dropouts have been completely mitigated, the presentation of the plots to the user becomes even more important.

FYI, the only other device on my hub when these measurements were taken is one which is sending and receiving a small packet of data once per second (<256bytes). And the idea of requiring additional computers sort of goes against the ‘throw the Joulescopes in your backpack*’ marketing approach.

*But don’t forget your extra computers

As an engineer, you know we have limited resources and bench space, not to mention documentation requirements for an equipment setup. The Joulescope is supposed to be simple. Just plug them in and go. Delving into the bowels of Windows, getting permission from IT to disable virus scanning, adding extra computers, etc. to HOPEFULLY eliminate dropouts is not how I want to spend my precious time. I am a real world engineer, doing real world testing, and am encountering this issue. Please do not just write it off… I love this product and want to see it on every engineer’s desk. That is why I present my real world issues to you.

Hi @wired

You can download Joulescope UI 0.8.12 from the download page (direct Win10x64 link). Here are the changes:

  • Fixed plugin window instances become invalid #74.
  • Improved logging for multiprocessing.
  • Fixed downsampled JLS files display dropped samples as 0 #75.
  • Added preference to elevate Windows process priority, enabled by default.

I think that we have several topics co-mingled here. I am going to attempt to detangle them.

1) Inconsistent display of missing samples
I agree that the waveform widget should display dropped/missing samples consistently across all zoom levels and data sources. I created and solved Issue #75. The fix is in 0.8.12.

2) Improved display of missing samples
I agree that this would be a desirable enhancement, and I created Issue #76.

3) Why is your computer dropping samples at regular intervals?
I mentioned two possibilities:

USB bandwidth limitations
First, you should connect your Joulescopes directly to USB ports on your host computer. No external hubs. In practice, USB hubs should work, but there are enough terrible hubs out there that you should start with USB connected directly to a USB port on your computer. Your computer internally has a one or more “root hubs,” which connect its USB ports to the CPU. Root hubs share USB bandwidth among the connected ports. From your email, it sounds like you were thinking about external hubs, not your host computer’s root hubs. If you have a desktop, the front USB ports are usually on a different root hub than the front USB ports. My point is that if you have a high-bandwidth USB device, you should connect that device to a different root hub than your Joulescopes.

CPU limitations
Your computer only has so much processing. The 0.8.12 release does elevate the process to “high” priority on Windows, which should help if you are using your Joulescopes while simultaneously compiling code and folding proteins.

4) What can you do to prevent your computer from dropping samples?
Troubleshooting a computer remotely with insufficient information is dubious at best. I gave you practical advice that could help. You are running two Joulescopes, heavily downsampled (which requires additional processing) alongside what sounds like multiple other hardware devices and software that I don’t know. Since you are using the Joulescope UI, which is independent of your other software, running Joulescopes on another computer is sound advice. I am giving you options.


Awesome! Thank you for taking the time to provide feedback.