Hi, UI version 0.9.3, Windows 10.
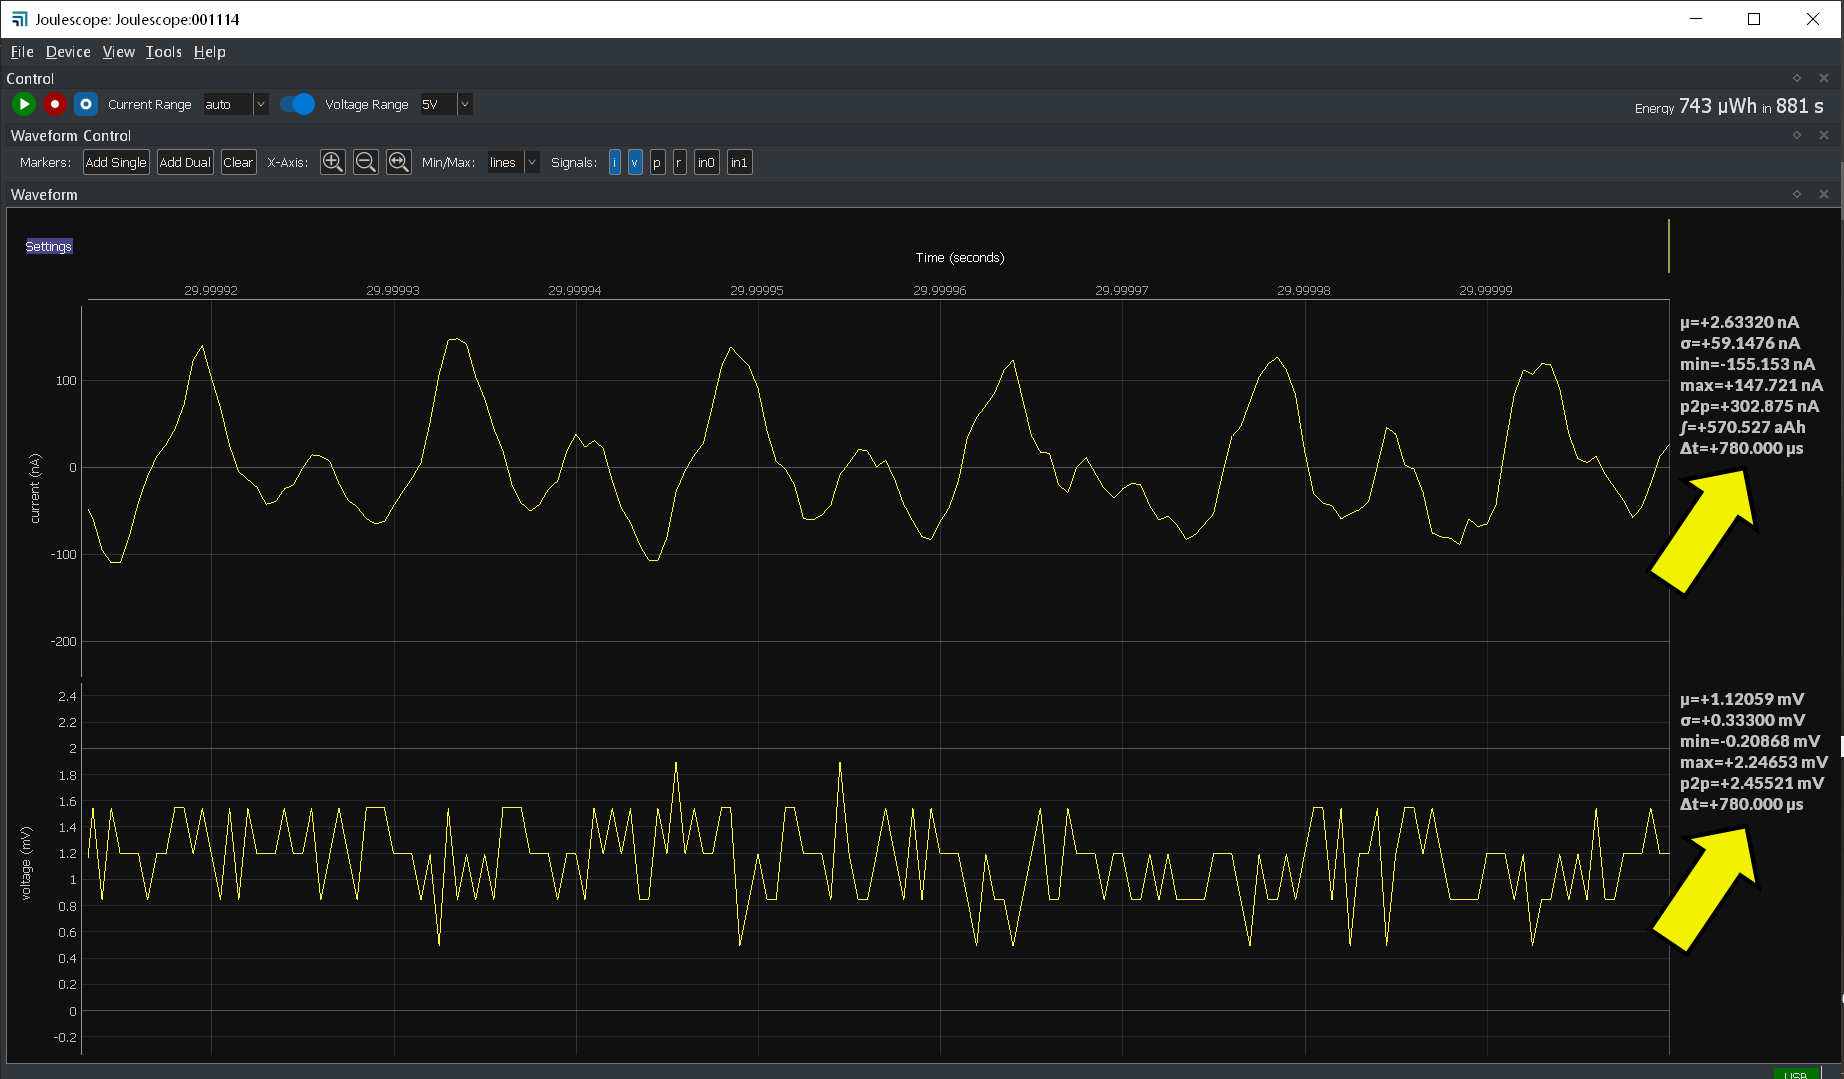
As I scroll-wheel deep into the graph, both live and after stopping the data stream, the Delta-t numbers at the bottom of the general parameter lists on the right (Marked with yellow arrows in the attached screenshot) start acting funny.
Here are the numbers I see after each scroll-wheel step into the graph:
+1.05250ms
+736.500us
+515.500us
+721.500us
+758.000us
+707.500us
+742.500us
…
Same numbers, in reverse order of course, appear as I zoom out again.
The graph itself seems to be zooming in and out just fine, it’s only the numbers that act funny.
Thanks,
Ido
Hi @igendel, and thanks for taking the time to explain this issue. I confirm that I can easily duplicate the same behavior.
Here is what I think is happening. As you zoom in, eventually a single Joulescope sample becomes wider than a single pixel. It appears that the UI requests more data than it needs, which the underlying Joulescope driver happily and correctly provides. The UI then draws the waveform correctly. Unfortunately, the statistics shown on the right are computed over all requested data, not just the displayed data. I will investigate further.
In the meantime, you can use dual markers to get accurate statistics when you are zoomed in this far. Right-click on the x-axis, then select Annotations → Dual Markers.
1 Like