Hmm, not sure if this is a new artifact with 0.4.5 or was there before. Just noticed this strange display. Note that during the ramp down the same current is measured, I placed a couple of annotations so you can see it.
If I zoom in/out it behaves very strangely, with the ramp amplitude changing and if zoomed in far enough I see:
Sid
Hi @SidPrice - I moved this post to a new topic.
I took a quick look and I was not able to duplicate this behavior. However, I think that I know what you are seeing. That current ramp looks too smooth to be real data, and I suspect that your computer lost some samples. This can happen if your computer gets overly busy or you are using significant USB bandwidth for another peripheral. You can see dropped samples statistics in the log files. On windows, you can find the logs under:
C:\Users\{your_user_name}\AppData\Local\joulescope\log
The log name is the starting timestamp in UTC time.
You can also open View → Developer. You care about skip_count which is the number of times a sample block was lost. sample_missing_count is the total number of samples dropped. contiguous_count is the total number of contiguous samples received in the current block.
Now, going back to the original question, the markers should really display something like “no data found” in this case. It looks like they are pulling the nearest valid sample’s data. A follow-on issue is what the waveform should display. A straight line is probably not the right answer…
Hi @mliberty, you are correct there are many “missing samples” lines in the log.
Plus, in the last test I ran I see the “skip_count” is “4.0”, I assume that means 4 samples.
I do have several USB devices attached to a single USB 2.0 hub, including the JS. Would having JS connected directly to the PC help?
One more thing that may affect the USB bandwidth is that I do all my development in a VMWare virtual machine. Should I perhaps install the software in the host and run it there?
As to what the display should show … a good question. The missing samples do seem to confuse it as you can see from the second capture above. Is a change of color possible when samples are lost, with the line repeating the last sample received?
Still loving my JS and I am happy to feed back things as they occur. I wish I was a Python/Qt programmer so I could help,
Sid
Hi @SidPrice - skip_count is the number of times a contiguous group of one or more samples was skipped. The sample_missing_count is the total number of samples skipped. Each USB frame transfers 126 samples, so you will always see drops in multiples of 126.
Joulescope uses a little over 8 MB/s, which is a good fraction of the ~25 MB/s available to a single device and ~50 MB/s theoretical maximum over USB 2.0. Having Joulescope on its own root hub (if possible) will help with any USB frame drops. I don’t know how much extra processing traversing into the VM adds or how it affects USB priority.
A quick note on USB: Joulescope is currently using a USB BULK endpoint for guaranteed delivery. Unfortunately, the PC’s USB controller is free to just not get data from Joulescope in this mode when it feels it has better things to do. I have considered implementing an ISO endpoint which gets guaranteed bandwidth, but no retransmission guarantee. Corrupted USB frames are lost forever, but at least your host PC is obligated to receive Joulescope data.
1 Like
Hi @SidPrice,
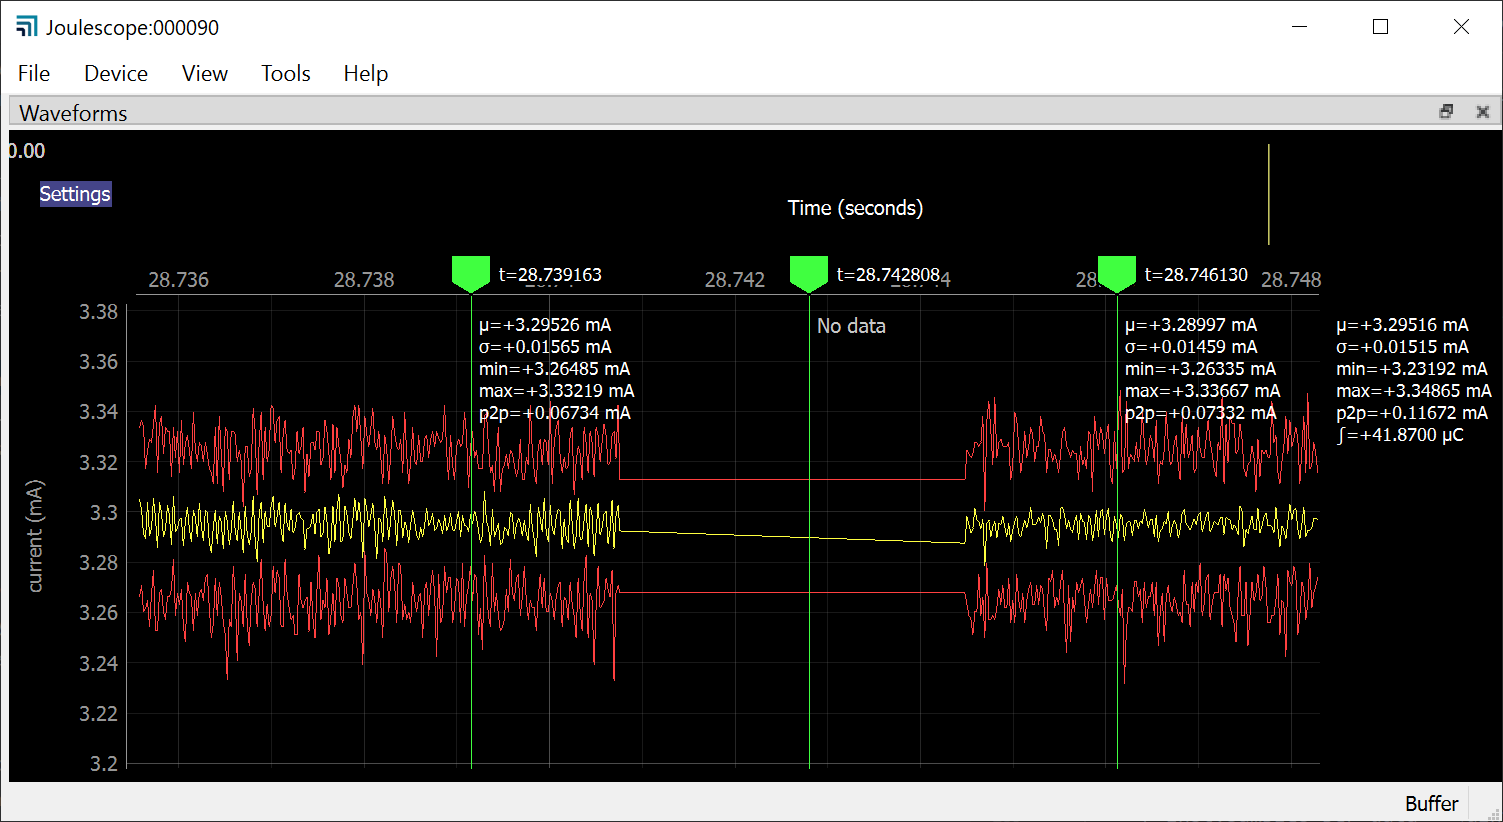
The upcoming 0.6 software fixes the display. When you place a marker over a region that does not have data (like dropped samples), it now shows “no data”:
1 Like
Thanks @mliberty, one more reason to love JS