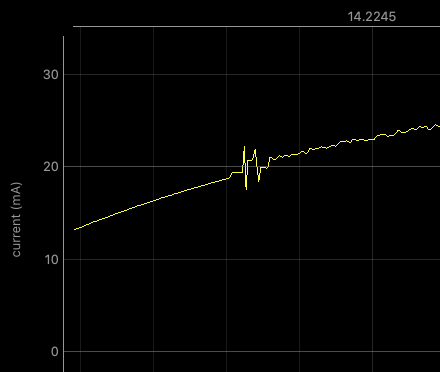
everytime the current range changes I do see measurement value artefacts which just don’t look good.
Here is an example:
For me it looks like the code within process() of raw_processor.pxi does something wrong. Can this be the case?
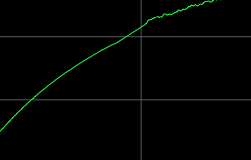
I really wonder why this code is so complex. I think it would be better to skip all samples while the current range changes and then insert linear interpolated samples based on the last value before the range change and the first value after the range change.
I changed my C/C++ code accordingly and now I get a nice straight line instead of the artefacts:
Hi @sbs - First, thank you for taking the time to write up and share your findings!
Yes, you are right that we should linearly interpolate over the several samples that are truly invalid on current range changes. The existing code simply inserts the mean, which explains the small flat part in the first graph.
In your code, how many samples are you linearly interpolating over? Are you using the same table values from raw_processor.pxi. Have you increased the number of samples?
For sake of simplicity I use a fix number of 8 samples to be replaced for every range change.
If you believe that the table from raw_processor.pxi is suitable then I will use it instead.
Btw: I really love the Joulescope. We now have three devices running in our department. They are most of the time the perfect replacement for our 16k€ Power Analyzer - and they don’t have an ear-killing cooling fan
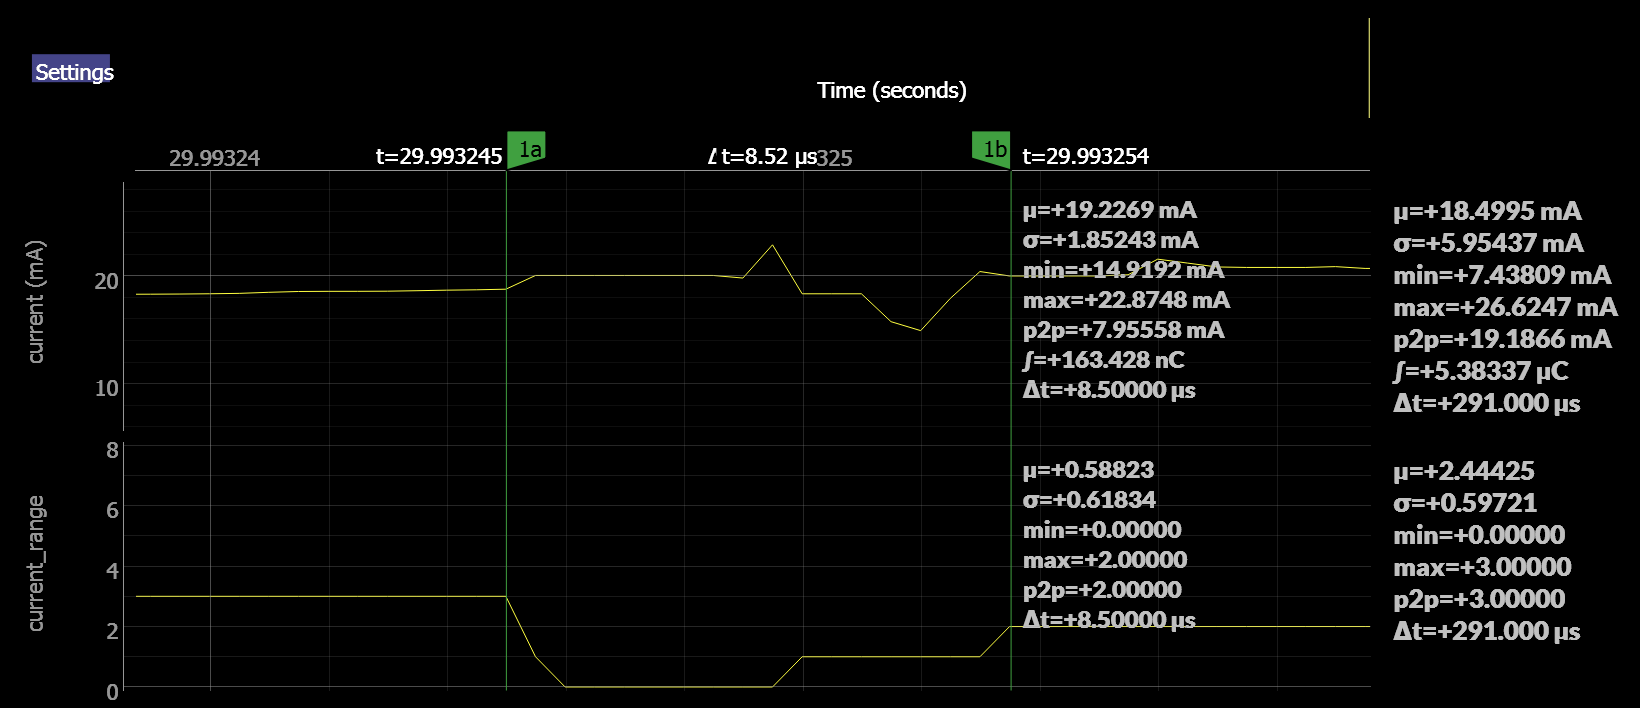
Thanks for following up! I took a look at the table, and the jump from current range 18 mA (3) to 180 (2) is 6 samples. Using 8 samples should not make as much difference as appears between the two plots. Perhaps something unexpected is going on with the Joulescope code. I will investigate. You are certainly free to use 8 sample constant duration (4 µs) in your code. I like fewer artefacts!
I originally corrected “Artefact” in your title to “Artifact” as I thought it was a typo. I later notice the same spelling in your post, so I looked it up. Turns out, I’m just from the other side of the pond
Great to hear! If you ever have any issues or questions, don’t hesitate to ask!
I believe that the issue is caused by having several current range changes in a row. So while one change is in progress another one happens. Then your code gets confused and creates artifacts. (with an ‚i‘ because my auto-correction is set to US English😉)
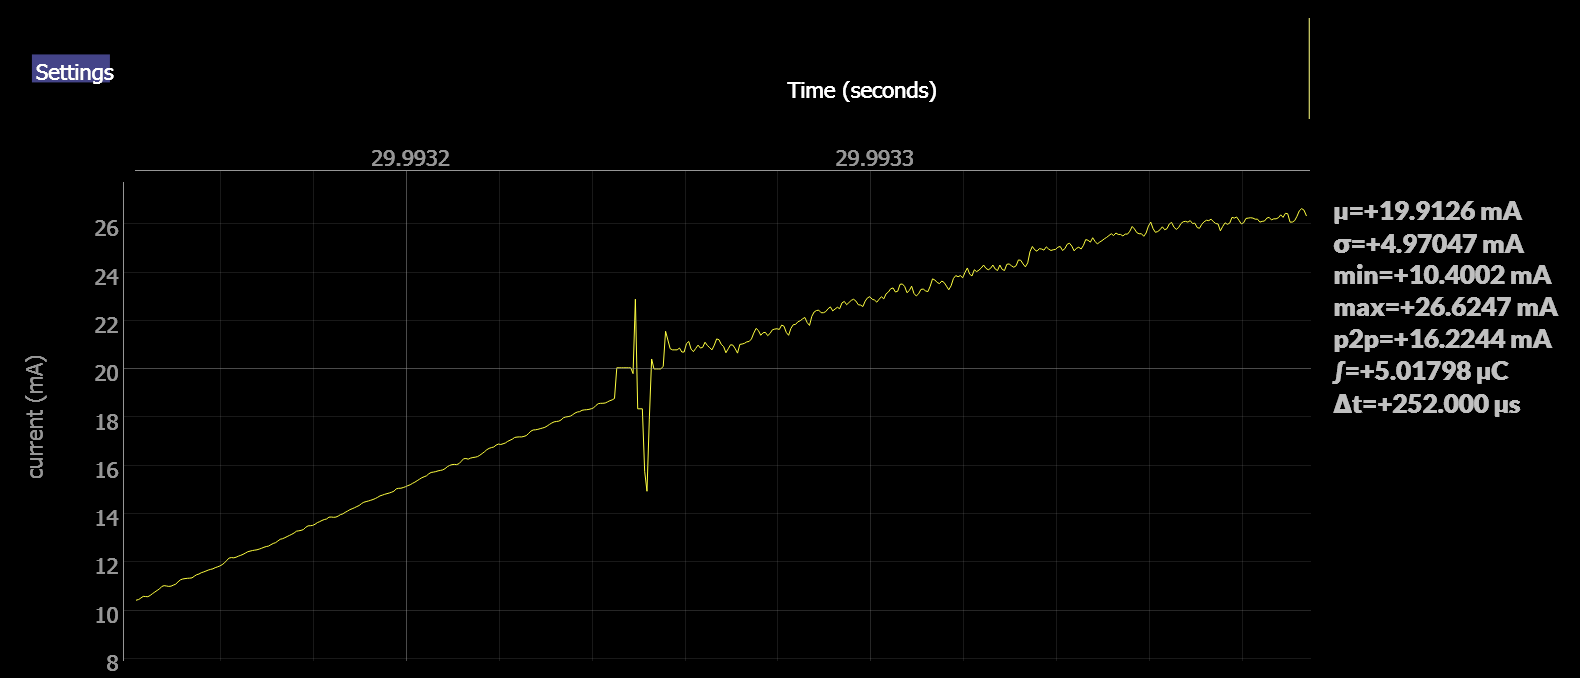
For the test, I used a bench supply set to 3V with one of my custom loads boards. The custom load takes a signal generator output and converts it to current by controlling a MOSFET. The resulting current was a 1 kHz sine wave with a low/high range of approximately 0.5 mA to 27 mA.
I have a few observations:
Instead of replacing samples with the mean, the algorithm should linearly interpolate. The resulting average value will be unchanged, but the curve will look much better.
This particular example starts at the 18 mA range, ranges to the 2A range before quickly going to the 10A range. It then downranges to the 2A range and finally settles on the correct 180 mA range. The result is right, but it took more ranging changes than I would expect. The current slope here appears pretty gentle, so I am not sure why the hardware decided to jump step from 18 mA to 2A in the first place. I will investigate.
As you have seen, raw_processor.pxi has a long history and can likely be simplified. It’s not something I want to change without lots of testing. I will schedule some time after I get this upcoming release out.
Thanks again for your time and for bringing this to my attention!