Showing time stamp

Hello,
Congratulations on your JS2220 Joulescope device. I just started my adventure with it and I have some problem with the GUI, or maybe it’s just a misunderstanding.
I have browsed the forum in the topic of “cursor time” and found a few threads, but comparing with the current version of the UI I was unable to find answers to my questions in the manual or on the forum.

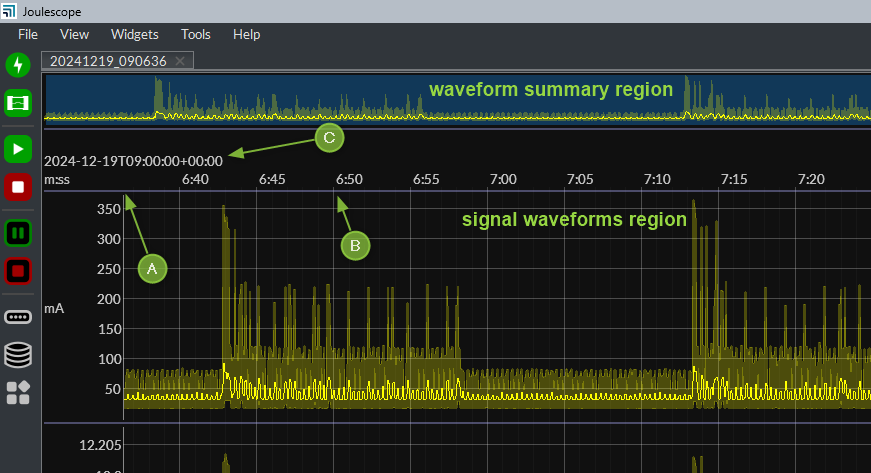
I created the file with default file name i.e. timestamp - 20241219_090636.jls when I load it to “Joulescope UI” I see following picture
(when no zoom, a focused only on time I intentionally omitted date below):

<picture 1>

A. The first sample in buffer comes from 09:06:36
B. Sample at this point is equal 09:06:50 (= 09:00:00 + 00:06:50)
C. When zoom is applied the time of the first sample in “signal waveforms region” and x-axes offset dynamically change

Q1. Is it possible more precise display the time of first sample with millisecond resolution ?
Q2. Can I set the time display on the x-asis (in seconds) from the beginning of the buffer regardless like in old version e.g. “Joulescope UI 0.10.13”?

<picture 2>


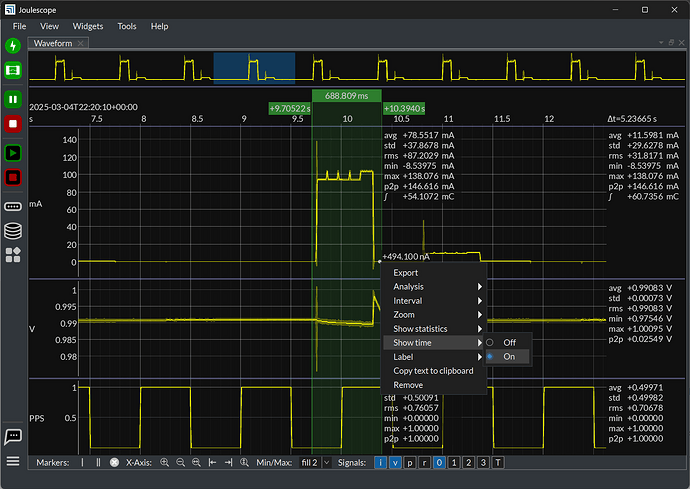
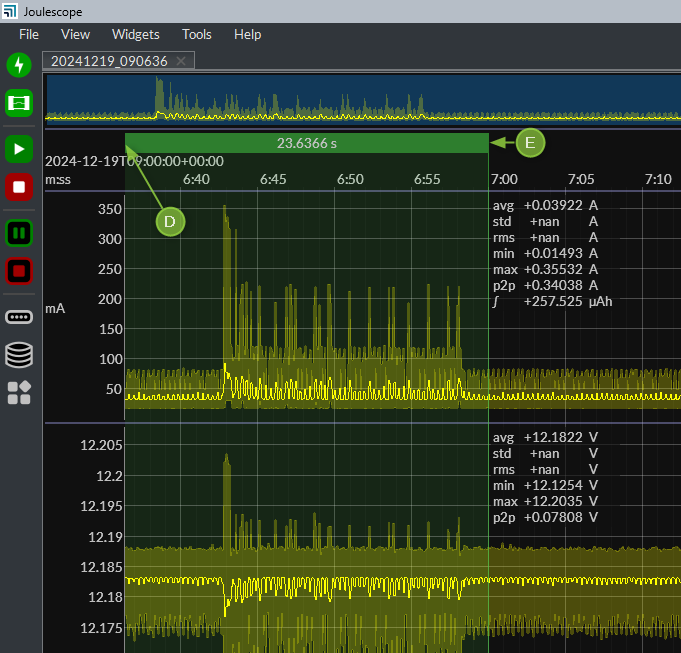
Q3. How can I enable showing offset in buffer for marker (C and D) in second (during moment and when it is already set) ?
Q4. Is possible copy to clipboard statistics and “time parameters” of marker (dual and single) ?

Short explanation why I ask about these things.
Joulescope is measuring the energy consumption of the device and at the same time are saving the logs from the device (with time stamps). I would like to be able to “synchronize data from the joulescope and the logs” i.e. focused some places indicated by the logs on the energy consumption graph. I need it to documented device behaviour.
I am using the Joulescope UI 1.2.4 and JS202 device.
Best regards,
Andrew
Hi @AndyW and welcome to the Joulescope forum! Thanks for the clearly annotated pictures which really help me understand what you are asking!

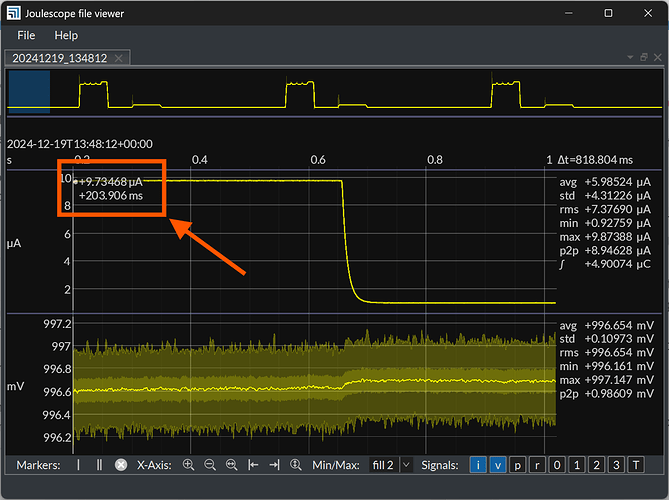
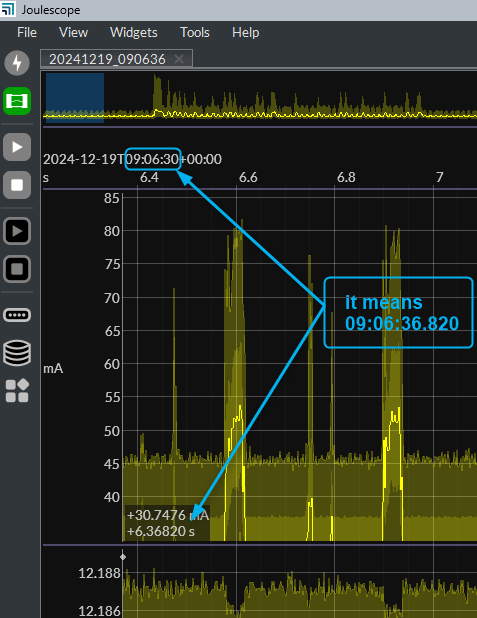
You can use the mouse cursor hover text to display the x offset for a pixel, like this:

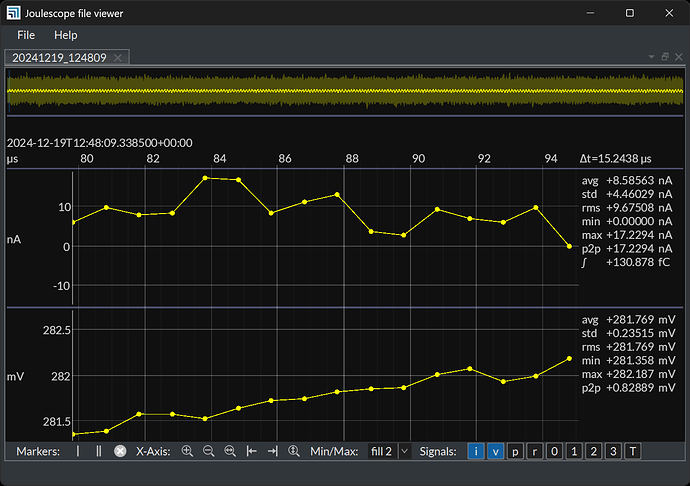
The x-axis labels only show on the major ticks. No feature exists in the Joulescope UI today to show the pixel 0 time. In general, the Joulescope UI displays appropriate resolution for the zoom. To get more precision, you can zoom in on the x-axis, like this:

Also note that the time of the “first sample” is a somewhat odd concept for JLS files. JLS files record signals that are not required to be time aligned, and often are not. So, the first current sample may not be at the same time as as the first voltage sample. You can get all the details using python:

python -m pyjls info -v {path/to/your.jls}

Note the different sample_id_offset across the signals.

Not today (Joulescope UI 1.2.4). I think that this is issue #220, which we keep putting off. Time is fundamental to the Waveform widget, so this change is far more invasive that you would expect. Every time I have considered adding this feature, I have decided that the feature is not worth the added complexity and high likelihood of introducing nasty issues.

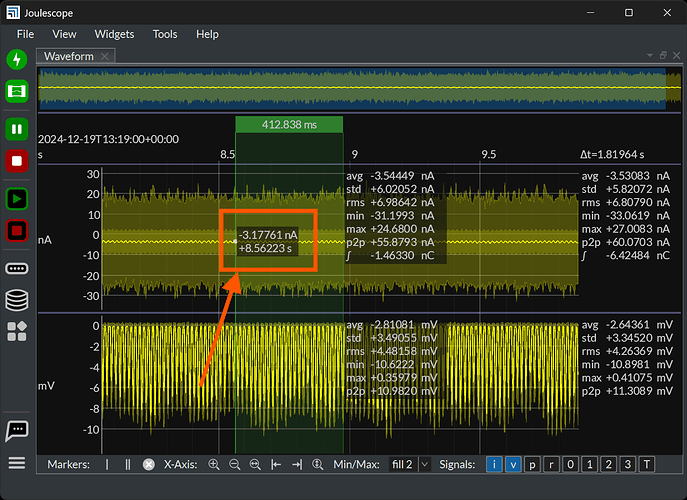
The markers do not currently have a way of displaying their UTC time. However, the hover text does:

Is this good enough for what you need?

Not today. We could add an option under right-click context menu → Show StatisticsCopy to clipboard. What do you think?

Thanks for the additional context!

We have a longstanding feature requests to add native UART support issue #153.

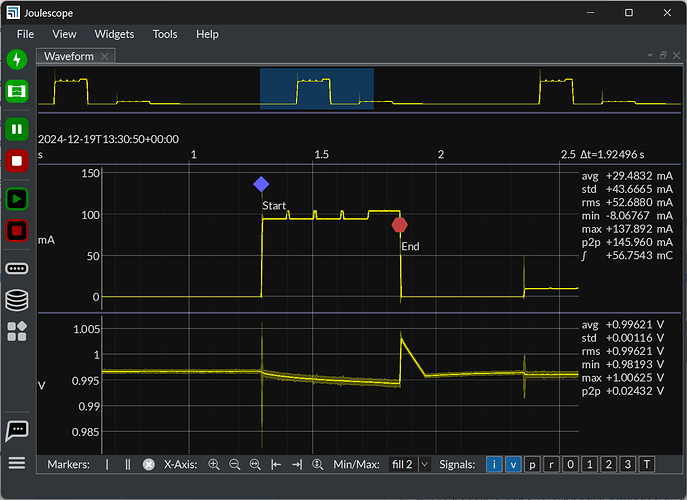
For now, you could import the critical events from your device logs as JLS text annotations. You can do this:

Alternatively, you can add dual markers over regions of interest.

You can use python and the pyjls to create a {filename}.anno.jls along side your {filename}.jls. The Joulescope UI loads both files. See the documentation and demonstration.

Unforunately, I just found that UI 1.2.4 no longer displays the text annotations correctly. Shapes work, but not if you add text. We now need to pass an int, not float, to PySide6, and we missed this case. UI 1.2.5 coming soon…

Thank you for such a quick and comprehensive answer.


Ans.1 “… cursor hover text to display the x offset for a pixel…”
It can be enough for me but at the beginning of my adventure with UI I was a little confused when I saw 6,36820s for “first sample” (I expected 0s).


Please correct me if I’m wrong


Ans.2 “Not today (Joulescope UI 1.2.4). I think that this is issue #220, which we keep putting off. Time is fundamental to the Waveform widget, so this change is far more invasive that you would expect. Every time I have considered adding this feature, I have decided that the feature is not worth the added complexity and high likelihood of introducing nasty issues.”

I understand you, because from the user’s perspective it is only to display something differently, but from the programmer’s perspective it turns out that there are more connections with other elements.
Regarding issue #220 - it looks like everything I would need is included there. So I would join the suggestion (request) to introduce such capabilities.


Ans.3 - “The markers do not currently have a way of displaying their UTC time. However, the hover text does:Is this good enough for what you need?”

For me, the time from the beginning of the buffer would be the most convenient. Unfortunately, setting a marker and helping yourself with the 'cursor hover position text" is very inconvenient.


Ans.4 - “…We could add an option under right-click context menu…”

As for me it’s a very good idea - please add it


“Thanks for the additional context!”

“Issue #153” - looks very interesting, if such a possibility appeared it would certainly make “synchronization” easier

I used UI 1.2.4 for a short time, but I saw the possibility of adding notes, however, due to “time problems” after a few attempts I changed to version 0.10.13, which provided me with a simple way of “synchronizing with the logs”

By the way today my UI updated to version 1.2.5 - I have one question about “Annotation/Vertical/Mode: Relative vs. Absolute”
I don’t understand what this setting is for in the case of a marker. Can you tell me something about it, or provide a description?

Hi @AndyW

  1. Yes, both the x-axis and the hover x value are relative to the UTC time displayed at the top left. The displayed UTC time occurs at or before the left-most data displayed. See the UTC rounding values used by the offset computation algorithm and x-axis ticks.

  2. Understood. I added this issue to the next planned Joulescope release. We’ll take another look, but no promises that it will be in the next release.

  3. Added issue 297.

  4. Added issue 298.


I have wanted to implement #153 for a long time, but it has never bubbled up the priority list high enough. I will consider how we can get this implemented!

How is UI 0.10.13 better for this than UI 1.2.5? Are your logs also in time relative to start?


The vertical markers support Absolute and Relative modes. When you add a marker in Absolute mode, the marker is associated with a fixed UTC time. When you add a marker in Relative mode, the marker is associated with a different from the right-most UTC time. The only time this matters is when you streaming samples from a connected Joulescope.

Here is a video showing the difference:

“How is UI 0.10.13 better for this than UI 1.2.5? Are your logs also in time relative to start?”
UI 0.10.13 first of all displays in a simple way the offset from the beginning of the buffer (in seconds and the markers also show the time) and together with the default file name (as a time stamp) it allowed me to quite easily synchronize the recorded data with the device logs (they also had time stamps). I had some trouble with the accuracy of the determined “time of first write to buffer”, hence my earlier question about the “time of first sample”.

Thank you for explanation “Absolute and Relative mode”.

Hi @AndyW - Thanks for the explanation! I think I understand. I will plan on spending some time with 0.10.13 in the new year to help better understand.

If you timestamp your logs with UTC, it makes things very easy with UI 1.x :wink:

Yes, it could be, provided that when setting the marker “its time position” is displayed (UTC) too. See below (last version of UI). I want to set marker on position “19-12-24 09:08:04”

Hover shows time in seconds (71.1167s), x-axes show offset in “mm:ss”, time in upper-left corner (“2024-12-19 09:07:00”) change every time when I make zoom in/out and no time with marker. Setting a marker in such conditions is really not convenient (you can try it yourself). That’s why it was easier for me to throw the log lines with time stamps into Excel, calculate the offset and use the old UI to find interesting ranges.

1 Like