Is it possible to have to time markers to be set on the graph of the measured signal to display all the relevant paramters withing the bounderies of the markers
Thanks,
Hi @Yehuda2591 and welcome to the Joulescope forum!
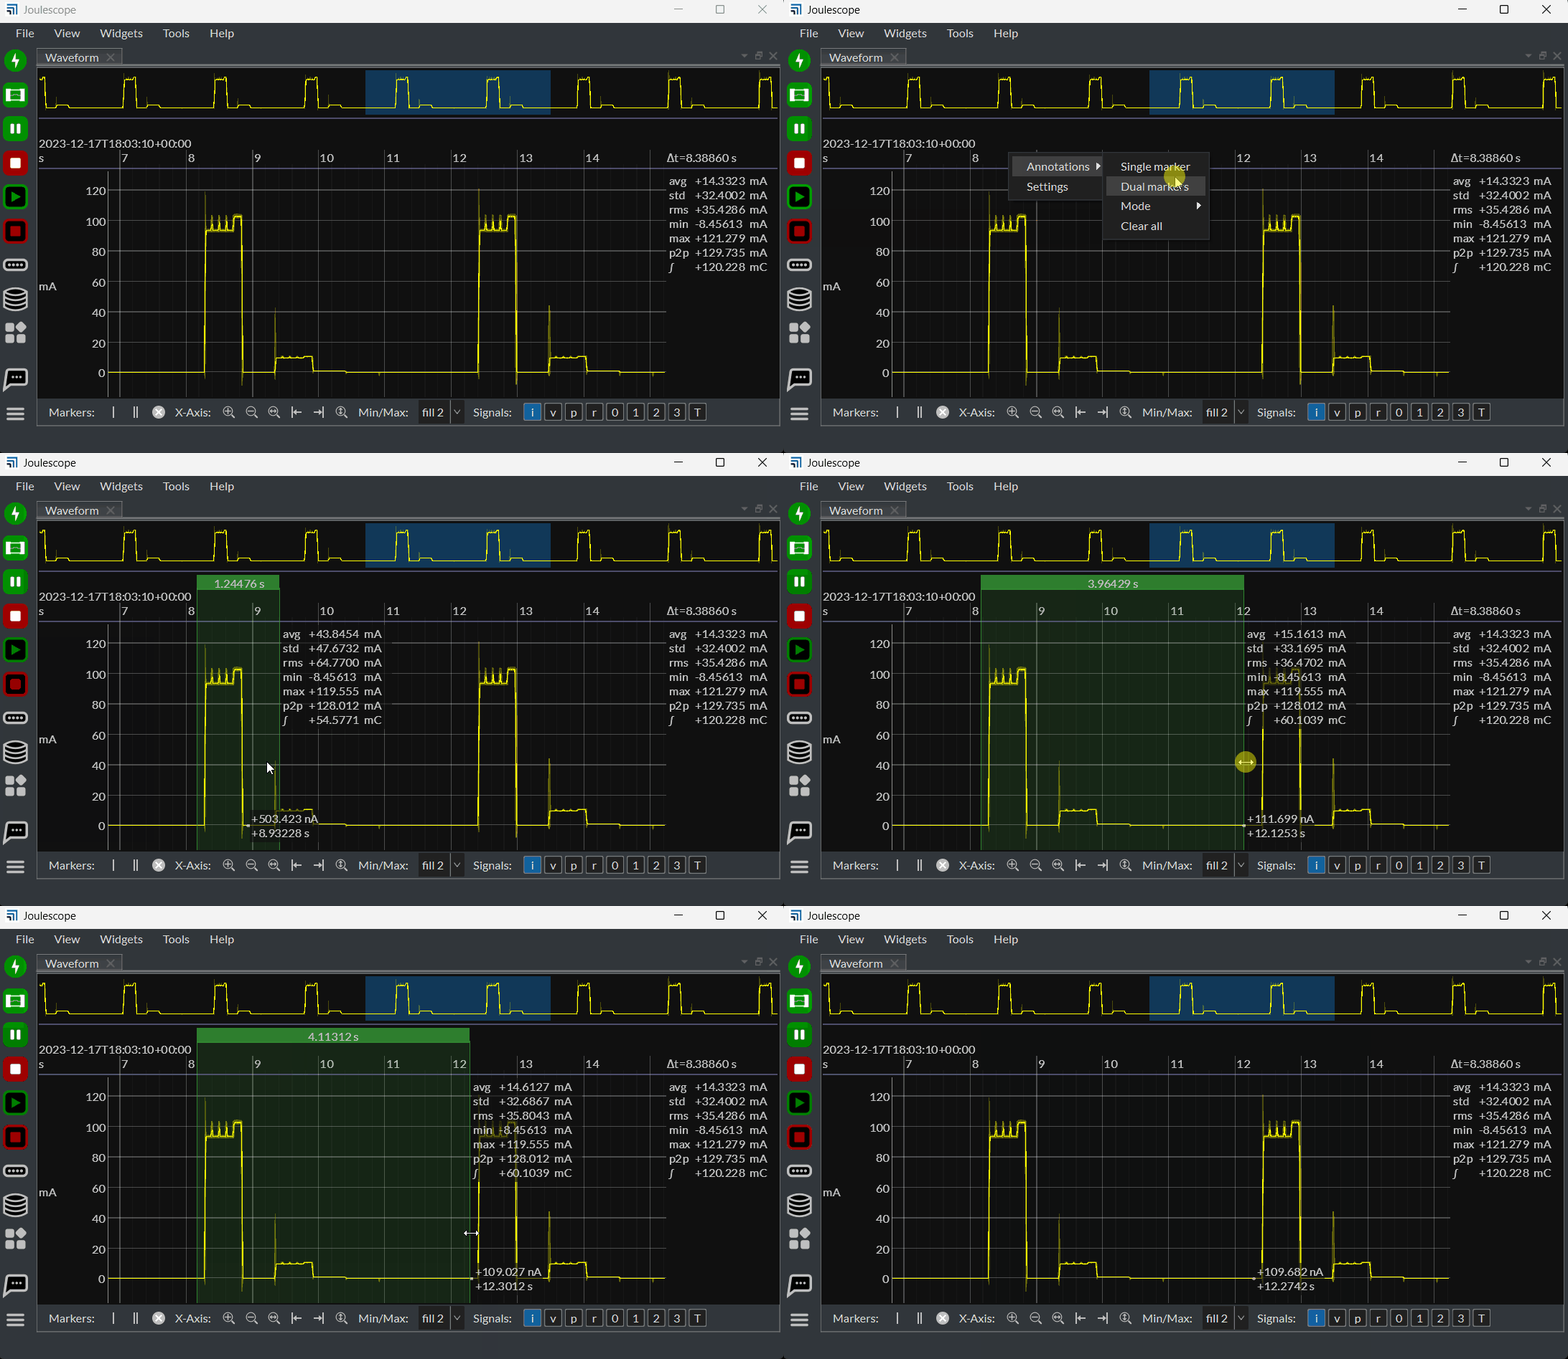
Have you tried adding x-axis dual markers? Right-click (control click on macOS) on the x-axis, then select Annotations → Dual markers, like this:

With the Joulescope UI, hover the mouse to display tooltips, and right-click to get context-sensitive actions.
Does this answer your question and get you the information you want from the UI?
Thanks for the info, it does reply to my question
1 Like