I have been investigating the power consumption of a new product I am working on. It has a Wi-Fi module on it and may be battery powered, so, I am interested in its power consumption. To test this I used “ping” to access the PCB and recorded the power usage.
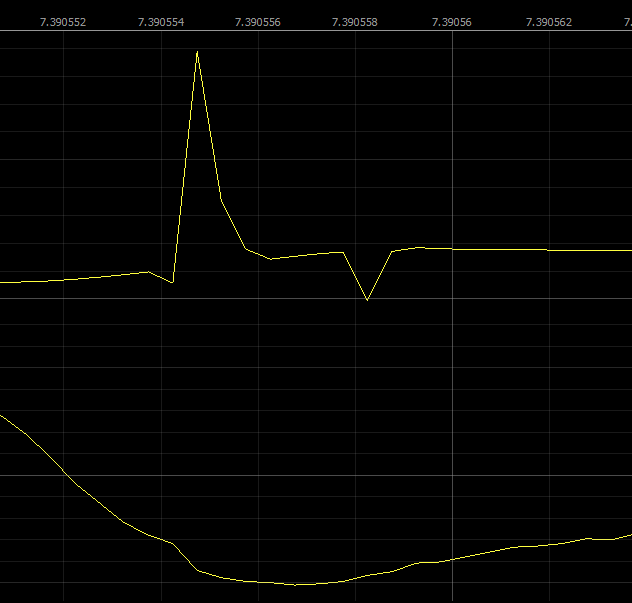
The following clipping is from the start of module receiving and replying to a ping. Bear in mind this is being powered through USB for the tests. The current before the module starts to reply to the ping is around 120mA, and while replying is around 350mA. What is odd is that the high “spike” is 1.7A, I find that hard to believe. Also odd is the dip just after the spike, just before the current flattens out.
Hi @SidPrice! Thanks for backing Joulescope and welcome to the forum! Great to hear that you are enjoying using your Joulescope so far!
You are right to be questioning these spikes. What you are seeing looks like the Joulescope range switching. The first spike looks to be about 2-3 samples (1 - 1.5 μs) switching to a higher current range. In this case, the selected higher current range was too big, and the second negative 1 sample glitch is adjusting to a lower current range.
If you have a repeatable signal, you can switch between auto ranging and a fixed current range to see the Joulescope switching artifacts. Choose the fixed current range to be greater than the largest current you will see over that duration.
Longer term, I plan on adding a post-processing option that better estimates the actual current through the range switching. The existing software is essentially displaying the raw data. The switching pulse actually contains some meaningful information that future software could use. When I add the ability to plot GPO0 and GPO1, I plan on also adding the ability to plot the current range. You could then explicitly plot the current range rather than guessing based upon spikes.
The Joulescope User’s Guide v0.5 has a little more detail about the current range switching starting on pages 24-26. I need to update this section with data from the production units. The production units are slightly faster, but not that much different.
Thanks @mliberty, I figured it was an artifact, I just could not imagine how anything on the PCB could suck 1.7A out of the supply. After I made the post I did run some tests with a fixed current range and there were no spikes.
I am looking forward to where the product goes, especially seeing the UI grow some neat features.
I just ran another test with a current range of 2A and I do still have spikes, plus, during the capture it appears the range is still switching as the test is run, at least the display jumps around.
Not sure how to attach a capture file to this post, is that possible?
Sid
Hi @SidPrice. If you select a fixed current range, your Joulescope should stay in that range, and any spikes should hopefully be from your device. The waveform y-axis autoranging in the oscilloscope view is entirely separate from the Joulescope automatic sense resistor selection autoranging. If you want to turn off the y-axis autoranging, right click on the y-axis (units or text, doesn’t matter), then click Range → Manual.
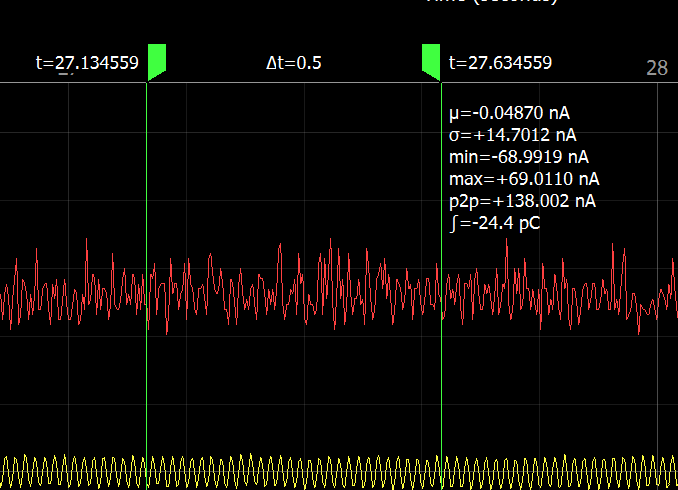
I just enabled posting jls files to this forum, but you have to keep the file size below 4 MB (just under 1/2 second). Using the oscilloscope view, zoom into a region where you suspect that your Joulescope is autoranging, add dual markers (right click on the x-axis, Annotations → Dual Markers), left click and then move the markers around your region of interest, and then export the data (right click on one of the markers → Export data. Then post that jls file here. I can inspect it for the actual current range selection.
In related news, I plan to add support for displaying the GPO waveforms and current range waveform sooner rather than later
I would guess that you did right click on x-axis, Annotations -> Single marker twice which gives you two single markers. Single markers only analyze & display data about the single point in time. Dual markers analyze the data between the markers. All markers are the same color for now, which makes this confusing, but the dual markers only have half a “flag” at the top. First clear your existing markers by right clicking on the marker, then Remove. Then right click on x-axis, Annotations -> Dual markers. You can then follow the instructions above. Does that work?
Your advice was correct, dual markers are needed and I did have a pair of single markers.
There is something odd somewhere because with the new test I just ran I don’t see the spikes any more, so I need to try to find out why. I will attach a “snip” from my previous capture that did show spikes.
Your uploaded file contains no actual sample data. Well, looks like I have an issue with the jls file writer. If you select less than about 0.2 seconds, it doesn’t write any data. The jls format operates on fixed sized chunks of data for efficiency (especially on load). Added to the list of issues to fix.
For now, try selecting between 0.2 seconds and 0.5 seconds of data. Sorry!
Are you able to install python 3 (direct download link)? The process is reasonably painless. Once python 3.7.3 is installed, open a command line and type:
pip3 install joulescope
If you didn’t add python3 to your path, you will need to provide the full path to pip under the Scripts directory of the python installation.
I can then provide a script that you can run to extract and optionally plot the current range from your JLS files.
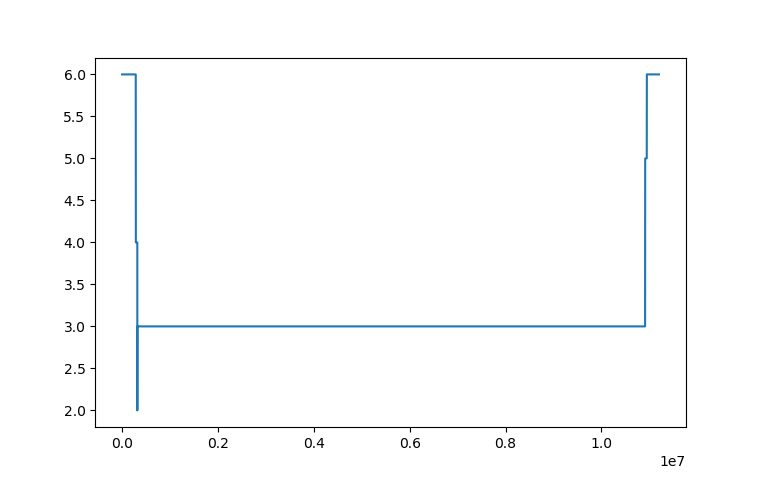
To plot the current range for a captured jls file:
python3 current_range_extract.py {my.jls} --plot
Note that current range 0 corresponds to 10A and current range 6 corresponds to 18 µA. Here is what I get with a capture using the Joulescope evaluation kit:
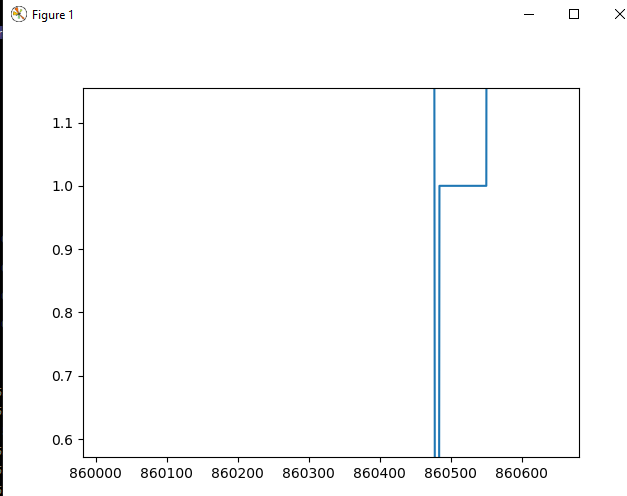
@mliberty, thanks, got the code and ran it on the capture, however it just appears to show what JouleScope shows, inverted. Not sure what extra I should expect to see. This is zoomed in to a spike.
I have placed the full capture on a cloud drive rather than fight the export/uploader, maybe it will reveal why I still see these single sample spikes.
That plot is showing the selected current range over time. Any change shows that your Joulescope has switch ranges which should not happen if you have selected a fixed range. If you manually specify a fixed range, you should just see a flat horizontal line.
I suspect that if you run the script on this file, then you will see a flat, horizontal line (no Joulescope current range changes).
I am not sure what is the difference between your first capture and this. If you find a way to duplicate the issue, let me know. I will also keep an eye out for issues that could cause a manually specified fixed current range to not stay in that fixed range.
There does appear to be some issue that we have so far not figured the trigger for. I just started up JouleScope and did not notice it was in auto-range mode for current and it worked without the spikes. Then, while typing this the JouleScope display froze.
I will monitor these issues and open another issue if I can be more specific with the trigger.