Unable to start UI v1.0.48 or v1.0.22

Hello!
I’m on a Windows 11 PC. Windows is up to date.

When I launch either of those UI versions, I get the spinney blue circle and a blank, white window. The program hangs in that state indefinitely.

I’ve tried uninstalling and reinstalling. I’ve tried running as admin. I’ve closed out all my programs. I’ve tried running with and without my Joulescope connected. And restarted my PC after the install.

I’m not seeing a similar issue the forum.

I’m stumped. Thoughts?

I am able to open and run v0.9.11. I’ll use that version in the meantime.

Thanks for the help.
Cheers,
MostlyHarmless

Hi @MostlyHarmless - Sorry to hear that you are having issues. This sounds like you have Intel graphics, selected the software OpenGL driver, and your computer does not like the software OpenGL driver (workaround in issue #216). This same behavior has happened on several other Windows 11 machines, and we have already reworded the Intel graphics dialog popup to only request switching to the software OpenGL driver if you encounter graphics issues.

This selection is stored with the rest of the Joulescope UI configuration. If you don’t care about your configuration you can delete it. Here is how:

  1. Close the Joulescope UI
  2. Open Windows File Explorer
  3. In the navigation bar, type %LOCALAPPDATA%\joulescope
  4. Select the config directory and press delete.
  5. Start the Joulescope UI

Does this fix the issue for you? If so, I also recommend that you update your Intel graphics drivers. The ones distributed through Microsoft seem to get out of date which may be the “real” cause of this issue. We also have issue #245. If you want, you can run UI 1.0.49 currently in alpha.

Does this fix the issue for you?

Thank you! Deleting the config directory fixed my issue.

That said, I am quite confident I did not select the OpenGL driver. Just in case that’s useful information for you or others. I am running an NVIDIA graphics card with up-to-date drivers.
Cheers,
MH

Great to hear that everything is up and working!

Can you double check that Windows is configured to use your NVIDIA graphics card for the Joulescope UI? You can find instructions in issue #216.

Interesting behavior… I’ll detail it here in case it’s useful.

Under System->Display->Graphics, when I added Joulescope to the list of programs, it was set to “Let Windows decide”.

I then selected my NVIDIA GPU at high performance, and I got the white screen. Closed JS.

I then put it back to “Let Windows decide” and now I still have the white screen. Closed JS.

I then erased the config folder again and now I’m up and running normally.

I then deselected “OpenGL” under settings, Closed JS and reopened and the waveform view is running in a very jittery manner. Multimeter view is OK. I reselected OpenGL and I got the white screen. Closed JS.

Opened JS. And it’s still jittery. Multimeter normal. Closed JS.

Deleted the config file. Opened JS. And I’m back to normal again on both waveform and multimeter view.

Dual monitors.
Windows 11 Pro v22H2 Build 22621.3007
Here are some system details:
NVIDIA GeForce driver 551.23
From the DirectX diag tool (maybe helpful?):
Driver File Version: 31.00.0015.5123 (English)
Driver Version: 31.0.15.5123
DDI Version: 12
Feature Levels: 12_2,12_1,12_0,11_1,11_0,10_1,10_0,9_3,9_2,9_1

While the OpenGL settings must be configured before starting the application, only the Waveform widget actually uses OpenGL features. I am guessing something about your setup does not like the UI OpenGL requested configuration. From joulescope_ui main.py:

def _opengl_config(renderer):
    renderer_map = {
        'desktop': QtCore.Qt.AA_UseDesktopOpenGL,
        'angle': QtCore.Qt.AA_UseOpenGLES,
        'software': QtCore.Qt.AA_UseSoftwareOpenGL,
    }
    renderer_qt = renderer_map.get(renderer, None)
    if renderer_qt is not None:
        _log.info('OpenGL render map: %s', renderer)
        QtCore.QCoreApplication.setAttribute(renderer_qt)
    QtCore.QCoreApplication.setAttribute(QtCore.Qt.AA_EnableHighDpiScaling)
    QtCore.QCoreApplication.setAttribute(QtCore.Qt.AA_UseHighDpiPixmaps)
    fmt = QtGui.QSurfaceFormat()
    fmt.setDepthBufferSize(24)
    fmt.setStencilBufferSize(8)
    if renderer == 'software':
        fmt.setVersion(2, 1)
    else:
        fmt.setVersion(3, 3)
    fmt.setProfile(QtGui.QSurfaceFormat.OpenGLContextProfile.CoreProfile)
    QtGui.QSurfaceFormat.setDefaultFormat(fmt)

I have a couple of requests:

  1. What is the model for this graphics card?
  2. Can you submit an issue report? In the Joulescope UI, select HelpReport Issue. If it submits correctly, it should list at least one file. We have had a few cases recently where communication with our issue reporter was blocked by corporate firewalls…

For what it’s worth, here is what the Joulescope UI reports to the log for my computer when the UI activates a Waveform widget:

INFO:2024-02-06 13:15:23,372:waveform_widget.py:251:joulescope_ui.widgets.waveform.waveform_widget.plot:OpenGL information:
            Vendor: NVIDIA Corporation
            Renderer: NVIDIA GeForce RTX 3060/PCIe/SSE2
            OpenGL Version: 3.3.0 NVIDIA 546.33
            Shader Version: 3.30 NVIDIA via Cg compiler

I did just check, and NVIDIA 551.23 is available. I will update. In the unlikely event that I can then duplicate what you see, I will post again.

A new symptom: in order to run Joulescope UI, I must delete the config folder every time I open the program. If I don’t, I get stuck at a white screen.

Here is my GPU model as reported in the log file:

INFO:2024-02-06 10:04:22,857:waveform_widget.py:274:joulescope_ui.widgets.waveform.waveform_widget.plot:OpenGL information:
            Vendor: NVIDIA Corporation
            Renderer: NVIDIA GeForce RTX 3080/PCIe/SSE2
            OpenGL Version: 3.3.0 NVIDIA 551.23
            Shader Version: 3.30 NVIDIA via Cg compiler

I have attempted to submit this in the UI as well but that did not seem to succeed. I’m at my home PC and did allow Joulescope through my firewall.
Cheers,
MH

Well, that’s not very convenient.

Could you try manually sending the Issue Report by email? Create an email to support @ joulescope.com, and then add an attachment. In the navigation bar, copy and paste:
%LOCALAPPDATA%\Joulescope\reporter

Then select the most recent file.

Sorry this did not upload automatically. I took a look at our server logs, and I don’t see an attempt. It was likely blocked somewhere…

No worries! Email is sent.

Thanks for sending the issue report through email. I took a look, and nothing is jumping out as the cause of the problem.

Since it sounds like this is painfully easy to duplicate, can you try this:

  1. When you see the white screen issue, force close the Joulescope UI.
  2. Open Task Manager and make sure you do not see any Joulescope or Joulescope UI entries
  3. Unplug the JS110 from USB
  4. Restart the Joulescope UI. Is it still a white screen?

I don’t see anything in the logs that says communication with the JS110 is to blame, but this quick check should help confirm.

I do get the white screen again after step 4.
Cheers,
MH

Thanks for doing this test. So, it’s not the JS110. I currently do not have any good leads, but I will take a fresh look in the morning.

Hi @MostlyHarmless - I suspect that we have some OpenGL-related issue. The Joulescope UI uses PySide6 / Qt with OpenGL for the Waveform widget. The UI configures the entire application for OpenGL at application start. If something goes wrong, then the entire application may not render, like you are seeing.

The OpenGL configuration should be the same on the first run and on subsequent runs, unless you manually changed it. However, the UI does save and restore the window and widget state, which will be different on subsequent UI launches.

I came across this issue with another application. Do you have multiple monitors? If you temporarily disable all monitors but one, delete the UI configuration, and then launch the UI twice, does this problem go away?

I feel like this is progress… Thanks for the leg work on your end.

Yes, using just one monitor removes the issue. Everything works as expected.

Here’s some new behavior for you. Maybe TMI?

One way to repro it.

  1. No Joulescope attached
  2. Delete config folder
  3. Open Joulescope UI. It starts on my primary monitor in multimeter view. No issues. Close UI.
  4. Reopen UI. No issues. Close UI.
  5. Reopen UI. Multimeter mode. Move UI to 2nd monitor/display. No issues. Close UI.
  6. Reopen UI. It opens on 2nd display. Multimeter mode. No issues. Switch to oscope mode. Windows starts on primary display. No issues. Close UI.
  7. Reopen UI. It opens on primary, oscope mode. No issues. Move to 2nd display. No issues. Close UI.
  8. Open UI. UI starts with large white screen on 2nd display (oscope sized). Locked up. Force close UI.
  9. Open UI. Same. UI starts with white screen on 2nd display (oscope sized). Locked up. Force close UI.
  10. Delete config folder. And repeat.

And another way to repro… changing things a bit…

  1. Still on Joulescope attached.
  2. Delete config folder.
  3. Open Joulescope UI. It starts on my primary monitor in multimeter view. No issues. Close UI.
  4. Reopen UI. Move multimeter window from display 1 to display 2. No issues. Close UI.
  5. Reopen UI. Multimeter opens on display 2. No issues. Switch to oscope view. Oscope appears on primary monitor. No issues. Close UI.
  6. Reopen UI. Oscope opens on display 1. No issues. Move to display 2. No issues. Switch to multimeter mode. Opens on display 1. Move multimeter to display 2. No issues. Close UI.
  7. Reopen UI. Multimeter opens on display 2. No issues. Switch to oscope view: locks up with a large black window and a white square. Force close UI.
  8. Delete config folder. And repeat…

And finally, if I duplicate my display rather than extending it… No issues.

Based on that issue you linked, perhaps I should try a clean install of my graphics drivers?

Hi @MostlyHarmless and thank you for the detailed testing to reproduce the issue! I tried both methods on my dual-monitor setup, and of course both work, so I could not duplicate what you are seeing. My NVIDIA GeForce RTX 3060 should be close enough from a driver perspective to your 3080, so it is more likely something with the computer setup / configuration / open programs.


Are you able to easily install python on this computer without some terrible corporate approval process? If so, I would love to know if you see any crash information when run from the console. We use to have faulthandler to log crashes, but faulthandler was causing crashes.

First, install Python 3.11. Here is the direct download link to the Python 3.11.8 Windows installer. Once you install and have python in your path, open a Command Prompt (or PowerShell) and type:

python -m pip install -U --upgrade-strategy eager joulescope_ui

This will install the Joulescope UI and all dependencies.

To run the Joulescope UI, type:

python -m joulescope_ui ui

Try duplicating the behavior. If anything prints to the console when the white screen occurs, please share!


It looks like reinstalling graphics drivers worked for one person, but not for others. Since uninstalling and then clean installing is likely not difficult, not time consuming, and should have limited downsides, go for it!

I don’t see any difference in the console between failure and success. The included capture is from a session where I switched from multimeter mode to oscope (on my secondary monitor) and the UI crashed.

I did reinstall my NVIDIA driver. That did not help.

Happy to help further. That said, I totally understand if it’s time to call it quits on this issue as it seems limited to my system.

PS C:\Windows\system32> python -m joulescope_ui ui
*****************************
* Joulescope User Interface *
* UI Version = 1.0.49       *
*****************************

info = {
  "joulescope": {
    "ui_version": "1.0.49"
  },
  "platform": {
    "name": "win32",
    "python_version": "3.11.8 (tags/v3.11.8:db85d51, Feb  6 2024, 22:03:32) [MSC v.1937 64 bit (AMD64)]",
    "platform": "Windows-10-10.0.22621-SP0",
    "processor": "Intel64 Family 6 Model 151 Stepping 2, GenuineIntel",
    "executable": "C:\\Users\\rutis\\AppData\\Local\\Programs\\Python\\Python311\\python.exe",
    "is_release": false
  }
}

=====

@MostlyHarmless - Thanks for testing more and reinstalling the driver. Unfortunately, you are not in the lucky person group where reinstalling the driver helped.


I do need to dig into this further. Given your great test reproduction notes, I may have been a little unfair to Intel Graphics in issue #216. While Intel Graphics was/is definitely an issue, I may have lumped a couple of other issue reports into this bucket when they may have been this restoring window position + OpenGL issue.

I just took a look at the code, and it does two things to restore the window position. In view.py currently starting at line 149:

        ads_state = pubsub_singleton.query(f'{topic}/settings/ads_state', default='')
        if ads_state is not None and len(ads_state):
            View._dock_manager.restoreState(QtCore.QByteArray(ads_state.encode('utf-8')))
        geometry = pubsub_singleton.query(f'{topic}/settings/geometry', default=None)
        if ui is not None and geometry is not None:
            ui.restoreGeometry(geometry)

The View._dock_manager.restoreState is for the Qt Advanced Docking System (Qt-ADS). The ui.restoreGeometry call is the normal Qt way to set the window size & position. I am not sure why Qt-ADS does not restore the main window size & position.

I will need do some research tomorrow. I will hopefully have some more options tomorrow morning.


In the meantime, if you are motivated, you might be able to run from source, comment out this code, and have the Joulescope UI run. You can find the source code on GitHub. If you are familiar with git, you can simply clone the repo. Otherwise, click on Code, download the ZIP, and extract tthe ZIP to the location of your chosing. Start by editting joulescope_ui/view.py to comment out lines 152-154 using a “#” character, like this:

        ads_state = pubsub_singleton.query(f'{topic}/settings/ads_state', default='')
        if ads_state is not None and len(ads_state):
            View._dock_manager.restoreState(QtCore.QByteArray(ads_state.encode('utf-8')))
        #geometry = pubsub_singleton.query(f'{topic}/settings/geometry', default=None)
        #if ui is not None and geometry is not None:
        #    ui.restoreGeometry(geometry)

At a Command Prompt or PowerShell, uninstall the pypi version of joulescope_ui you installed previously:

python -m pip uninstall joulescope_ui

Then:

cd {path/where/you/unzipped}
python setup.py sdist
python -m joulescope_ui ui

Does it now work for you? If so, we have a temporary workaround, it just will not remember the size and position of the main window. If not, you can also try commenting out the rest of lines 149-154. If you try any of this, please let me know how it goes!
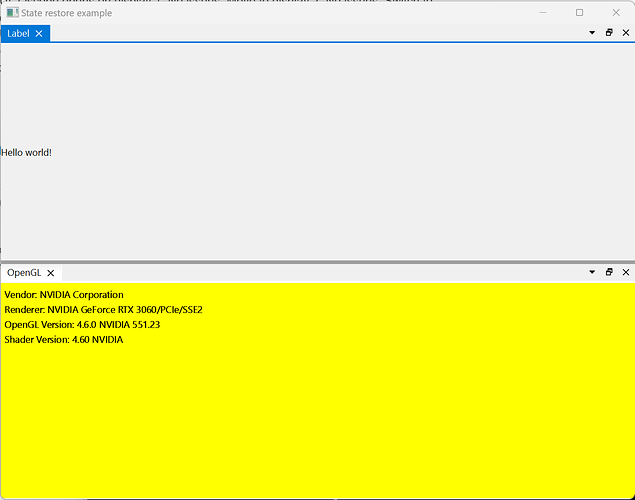
I put together a minimal example. Can you try to duplicate the issue using this minimal example? Download the following file and put it anywhere you want:
main.py (4.5 KB)

To duplicate:

  1. Open Command Prompt or PowerShell:
  2. cd {path/where/you/put/main.py}
  3. python main.py ← should run correctly on 1st monitor
  4. Close the window
  5. python main.py ← should run correctly on 1st monitor
  6. Move the window to the 2nd monitor
  7. Close the window
  8. python main.py ← should hopefully “lock up” on 2nd monitor

I expect you to see this when run correctly:

If you want to start over, type del main_state.json, which will remove the serialized state that is restored with each run.

Are you able to duplicate the problem with this minimal example?

Yes! That does duplicate the problem.
Cheers,
MH