Hi there Matt,
please assist on this.
We are trying to switch from our older go-to instrument Keysight N6705C DC Power Analyzer using N6782A autoranging SMU modules to the Joulescope, mainly because it’s so much faster in sampling rate.
Our systems are low power and the specific use case we are studying at the moment is a ‘go to low power mode and wake-up every 27 ms for a certain task and fall back to low power mode’.
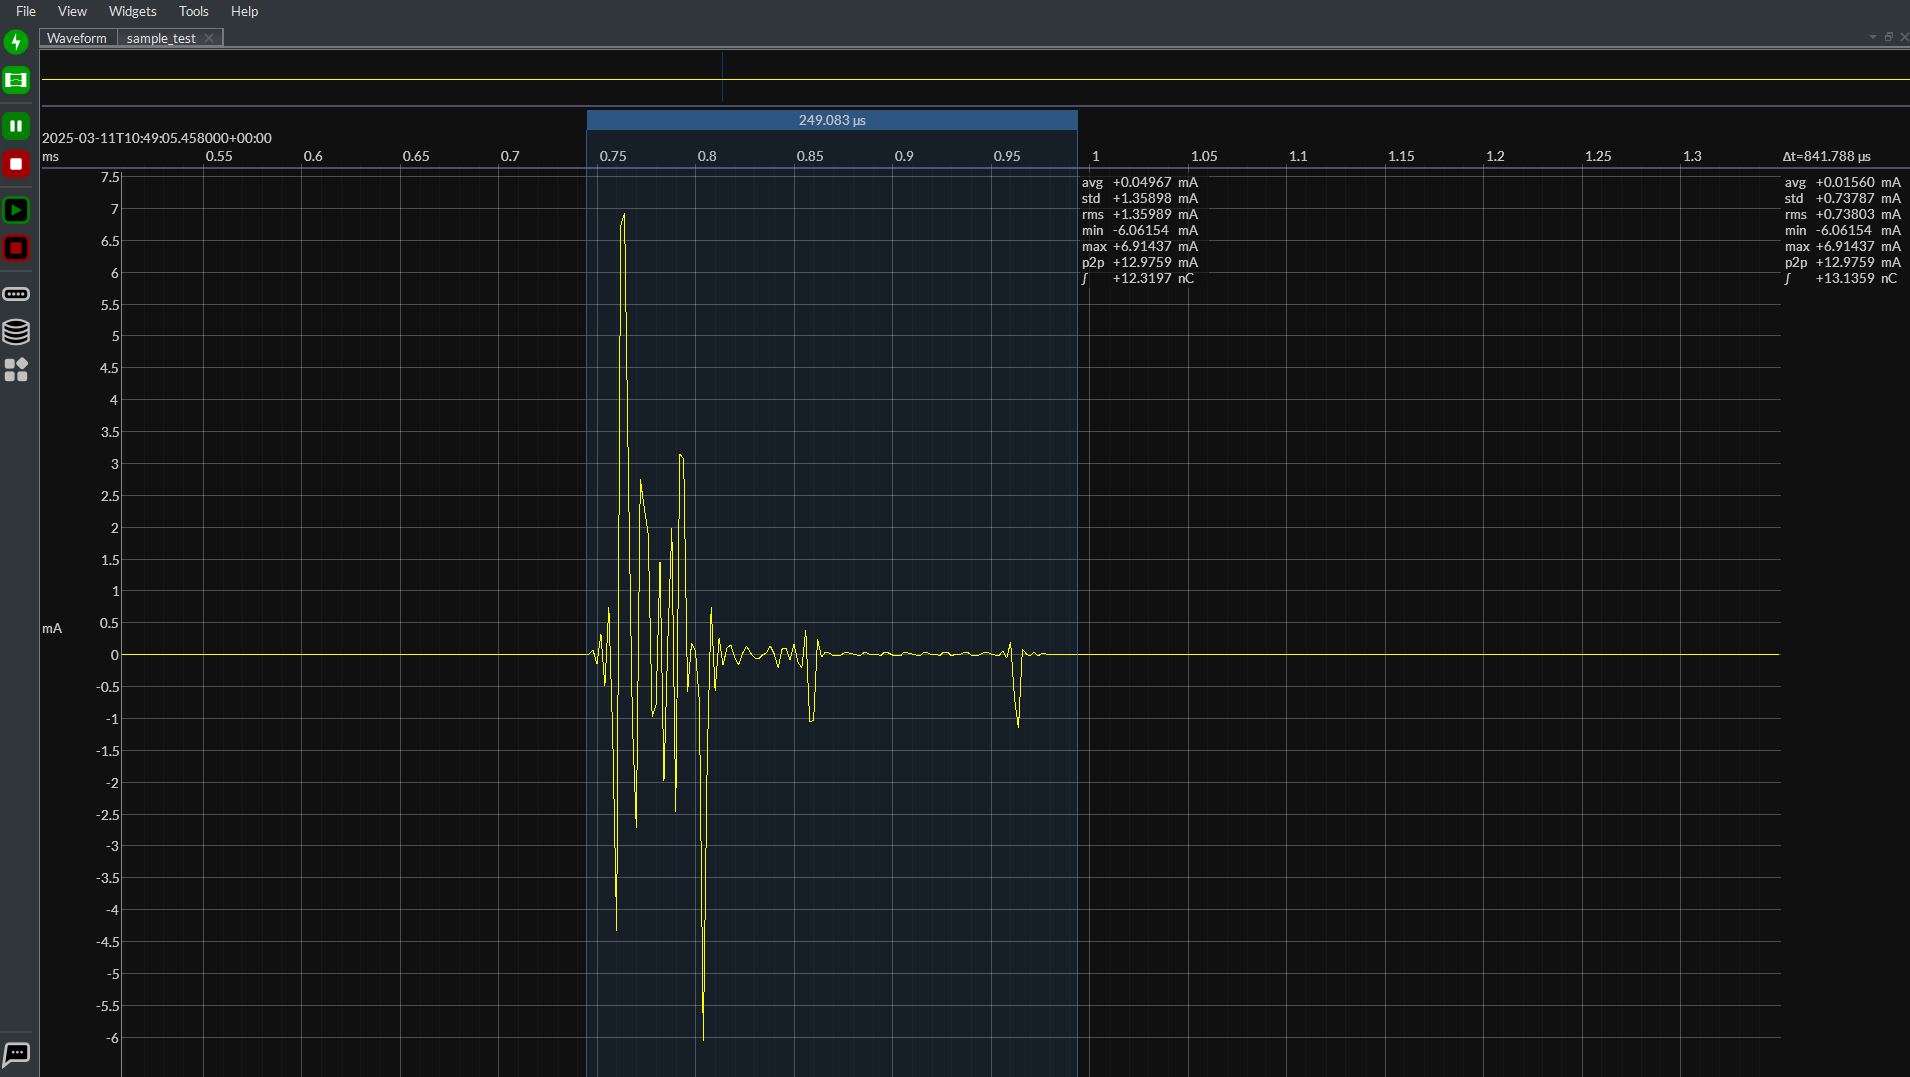
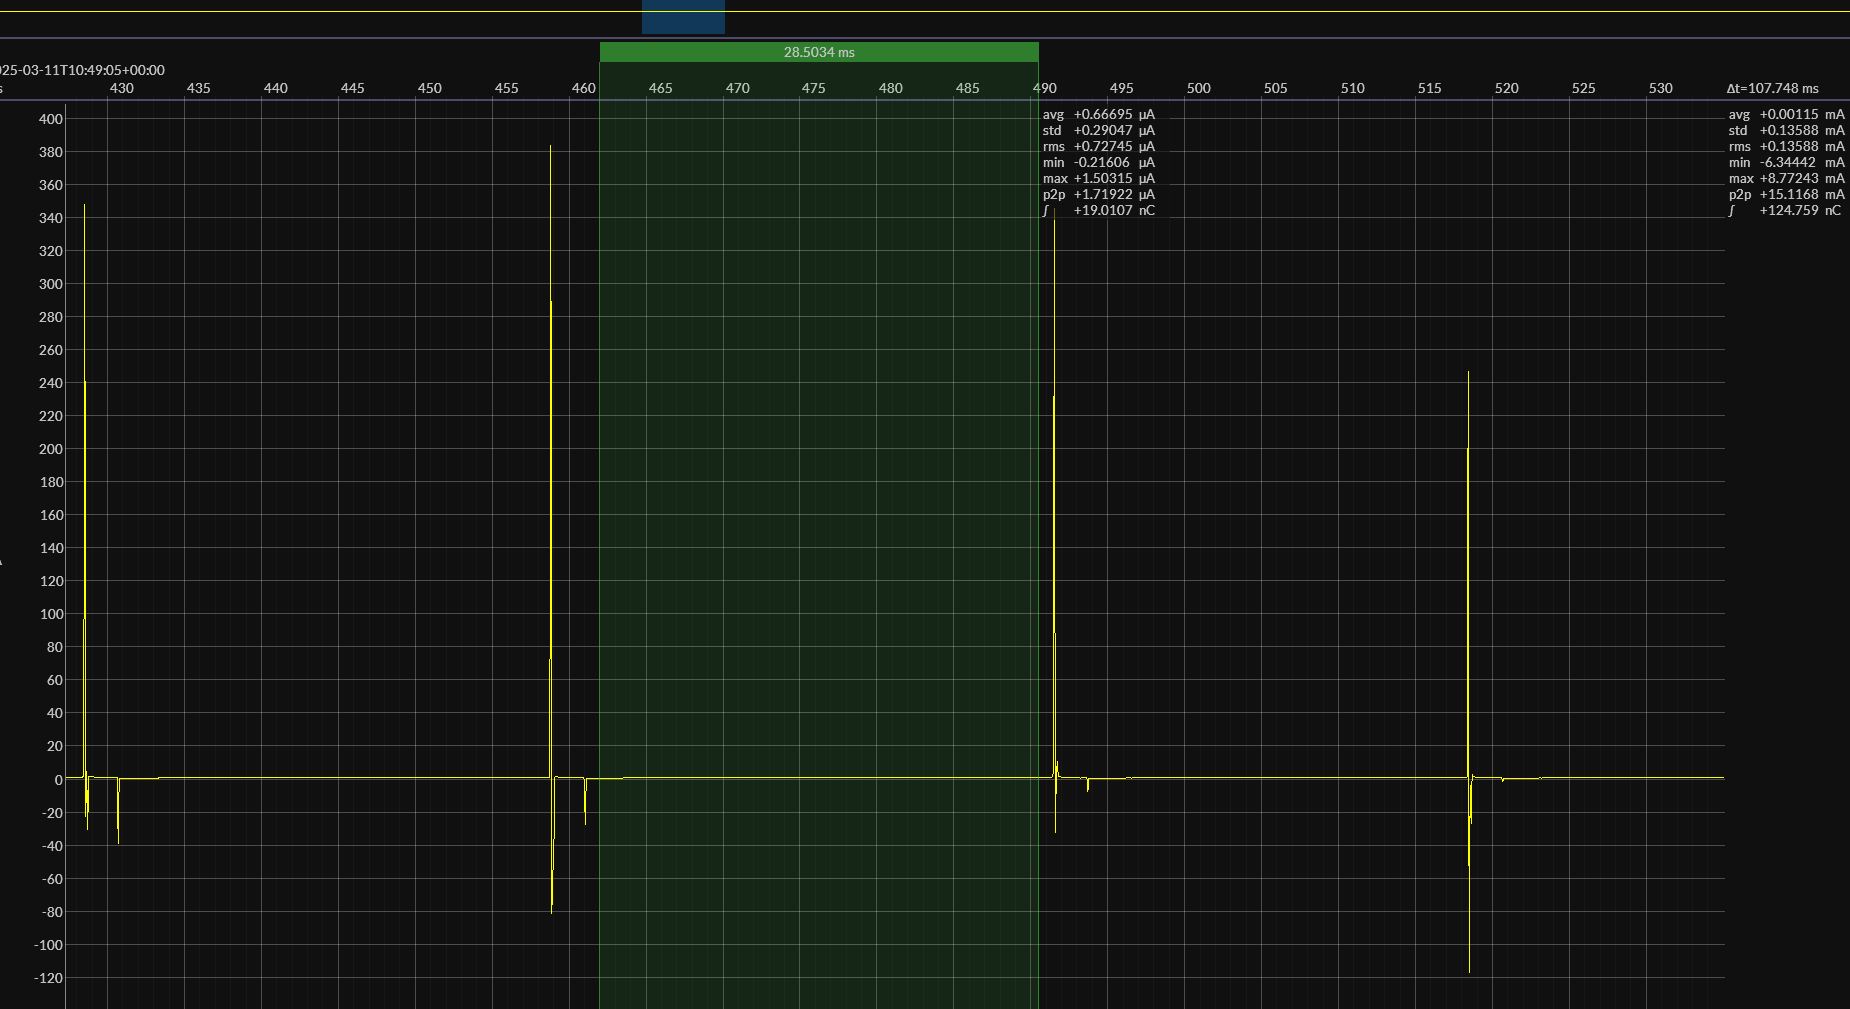
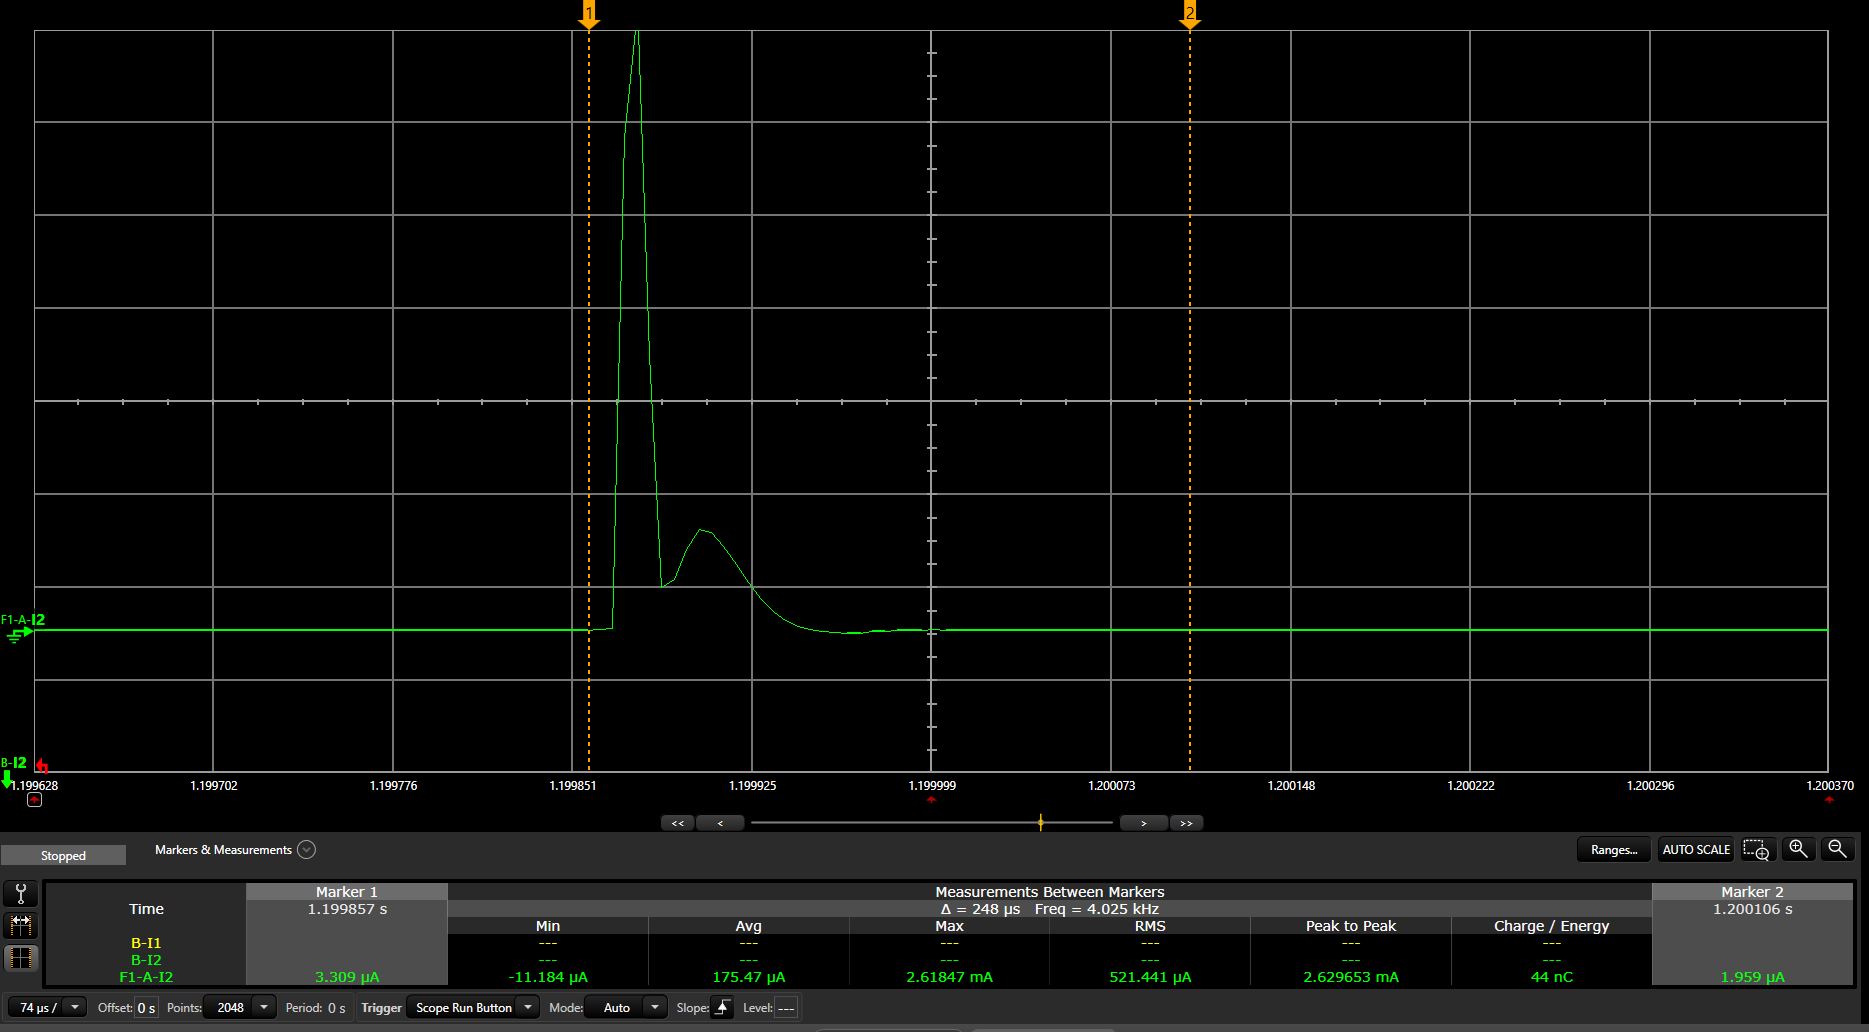
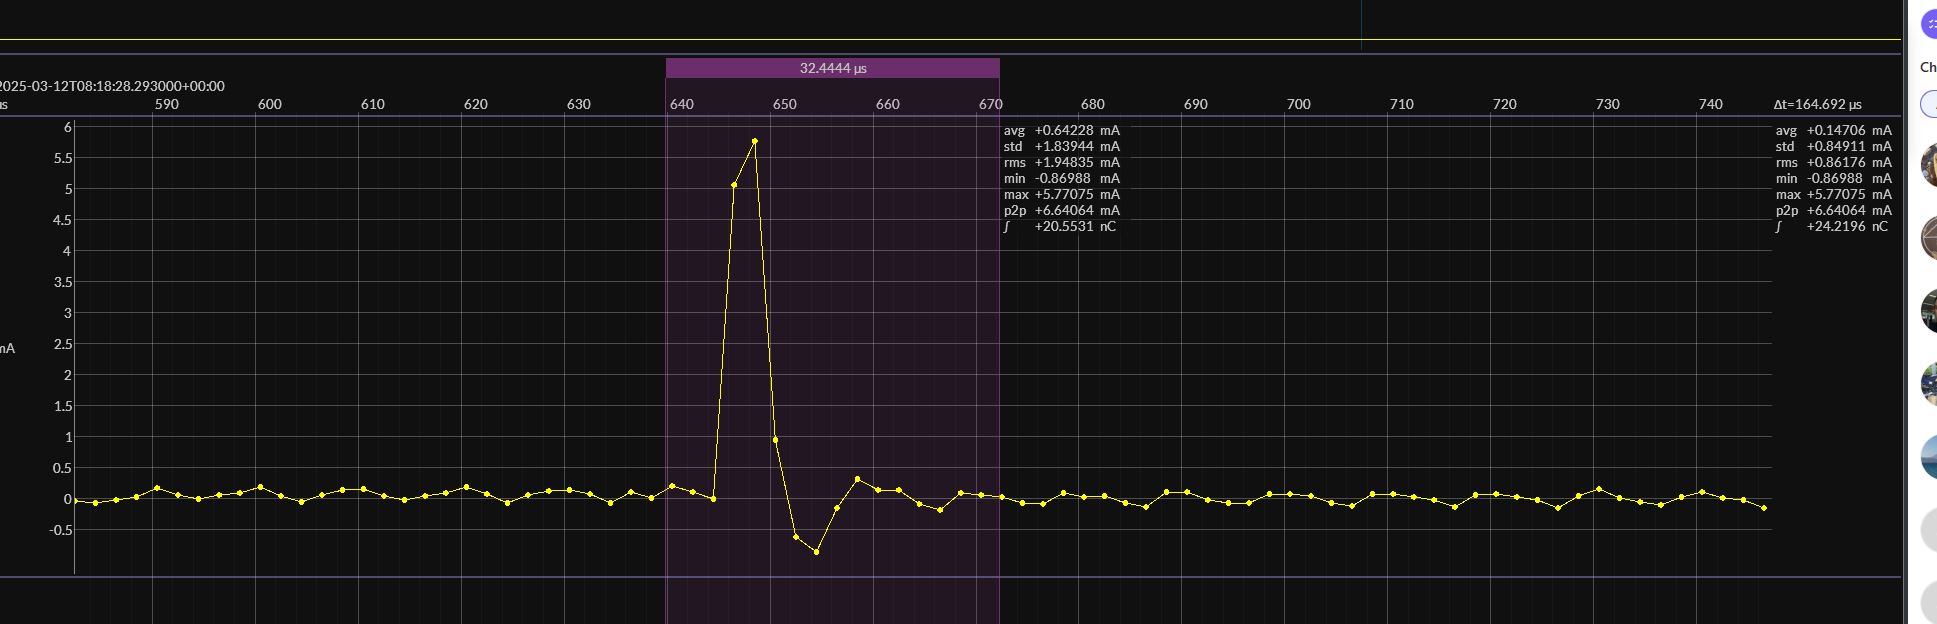
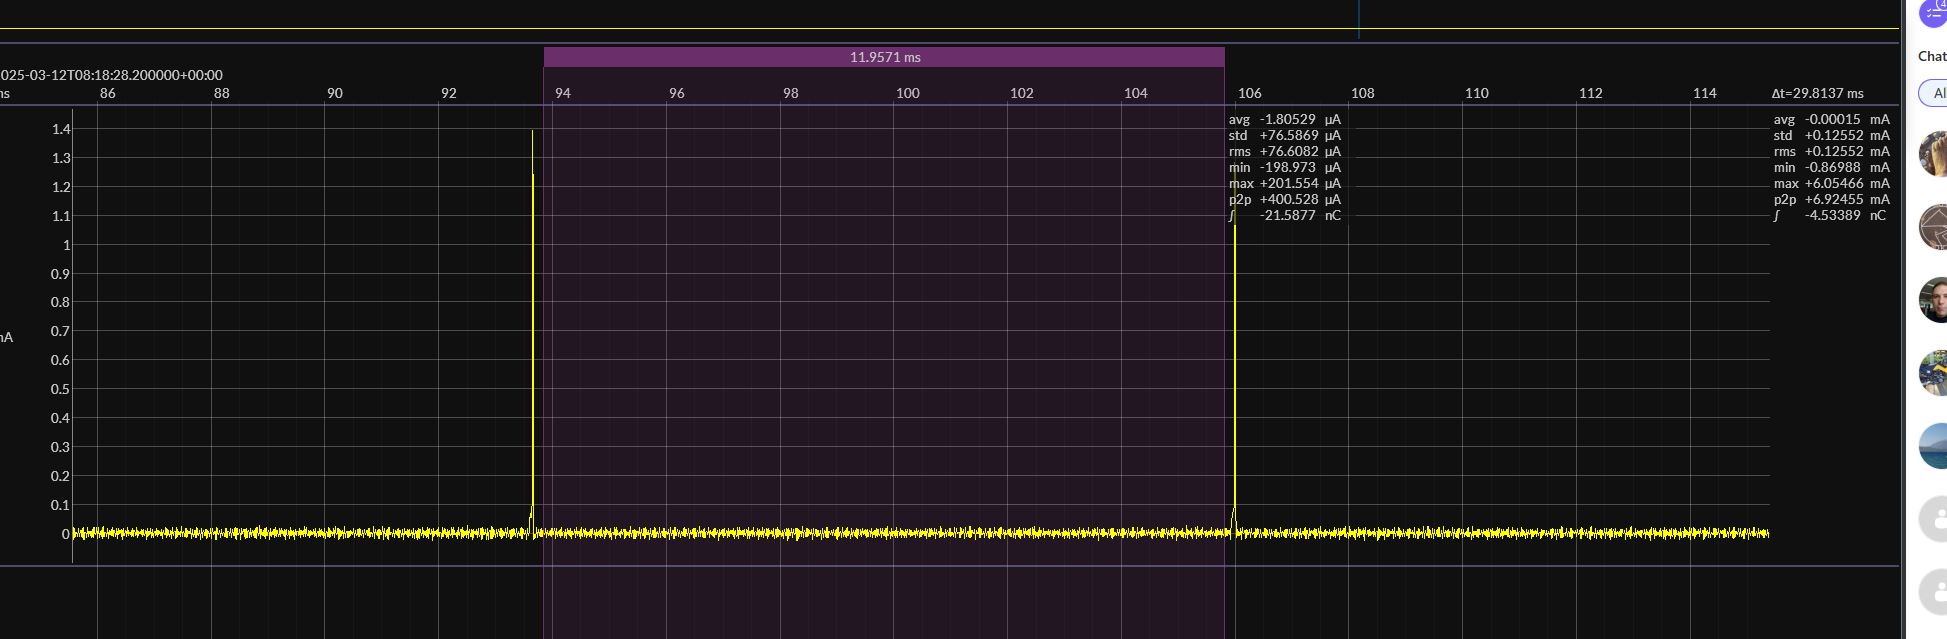
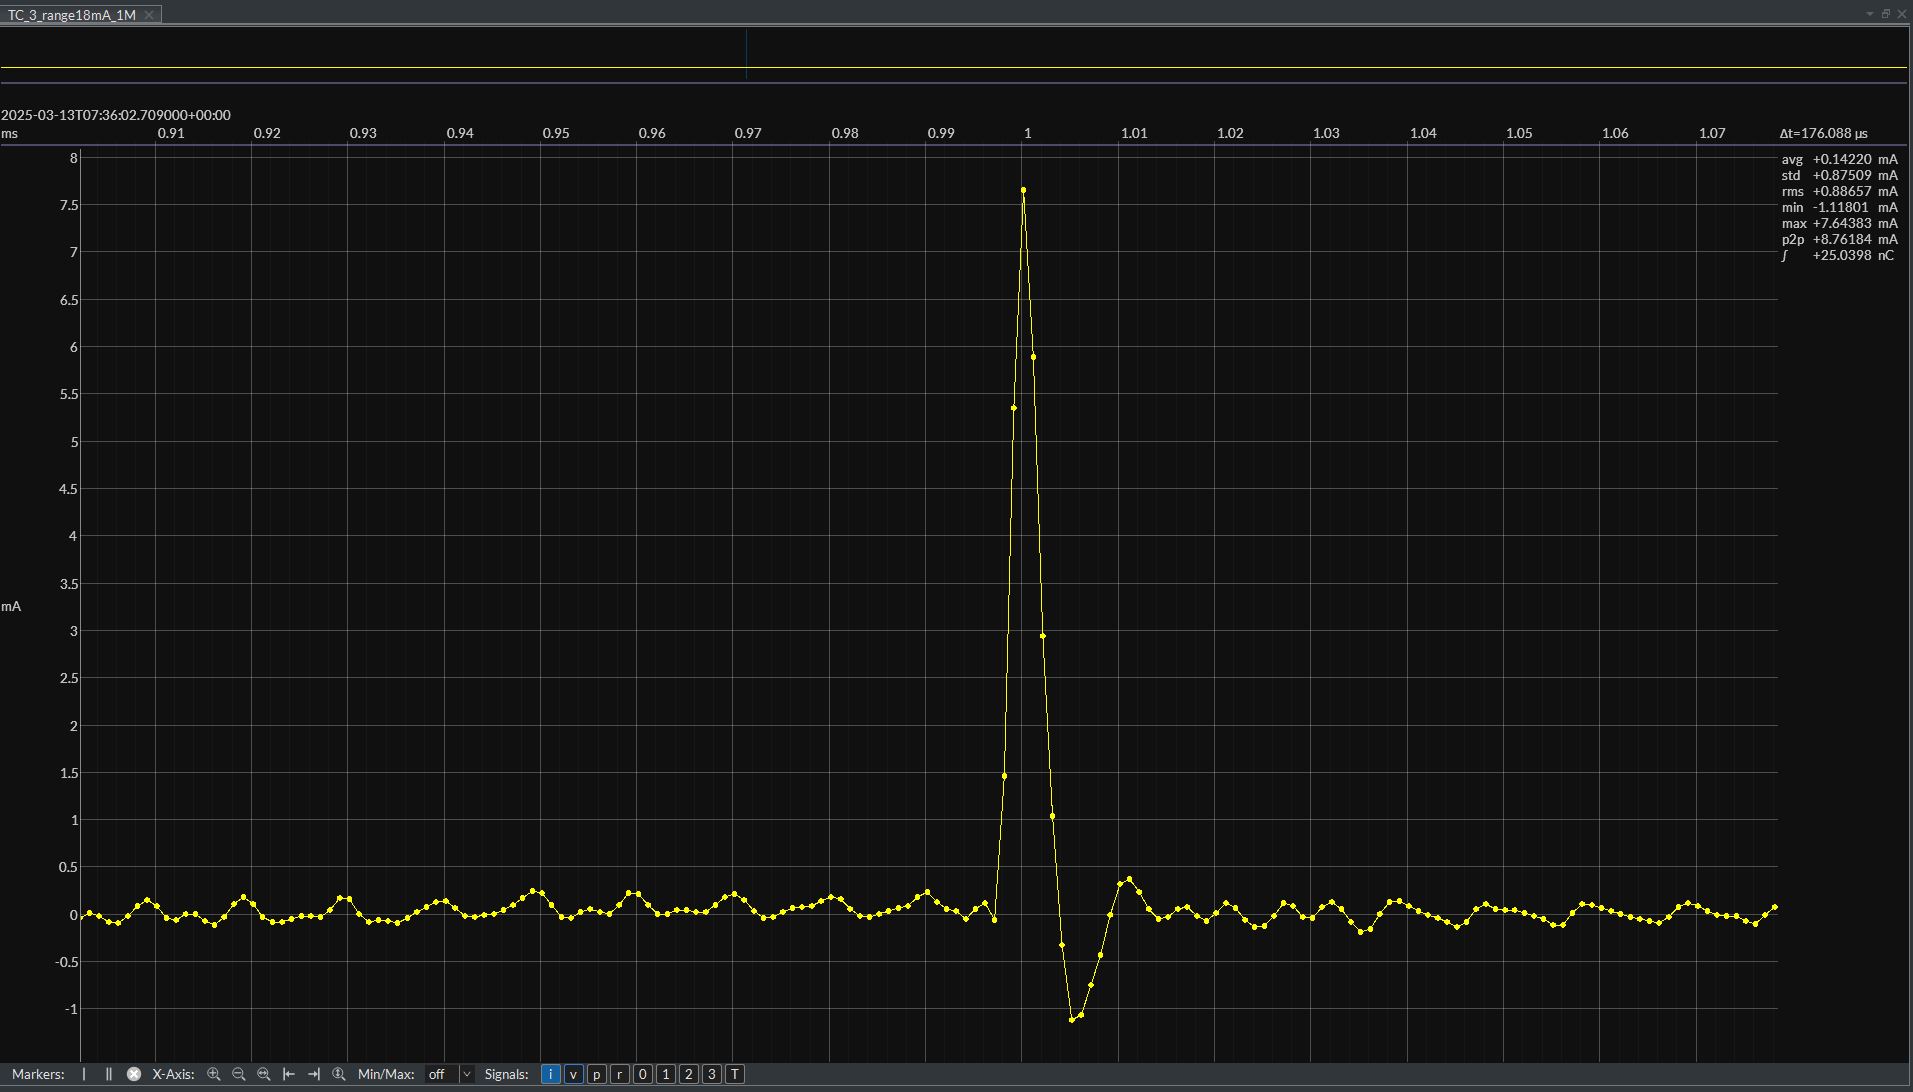
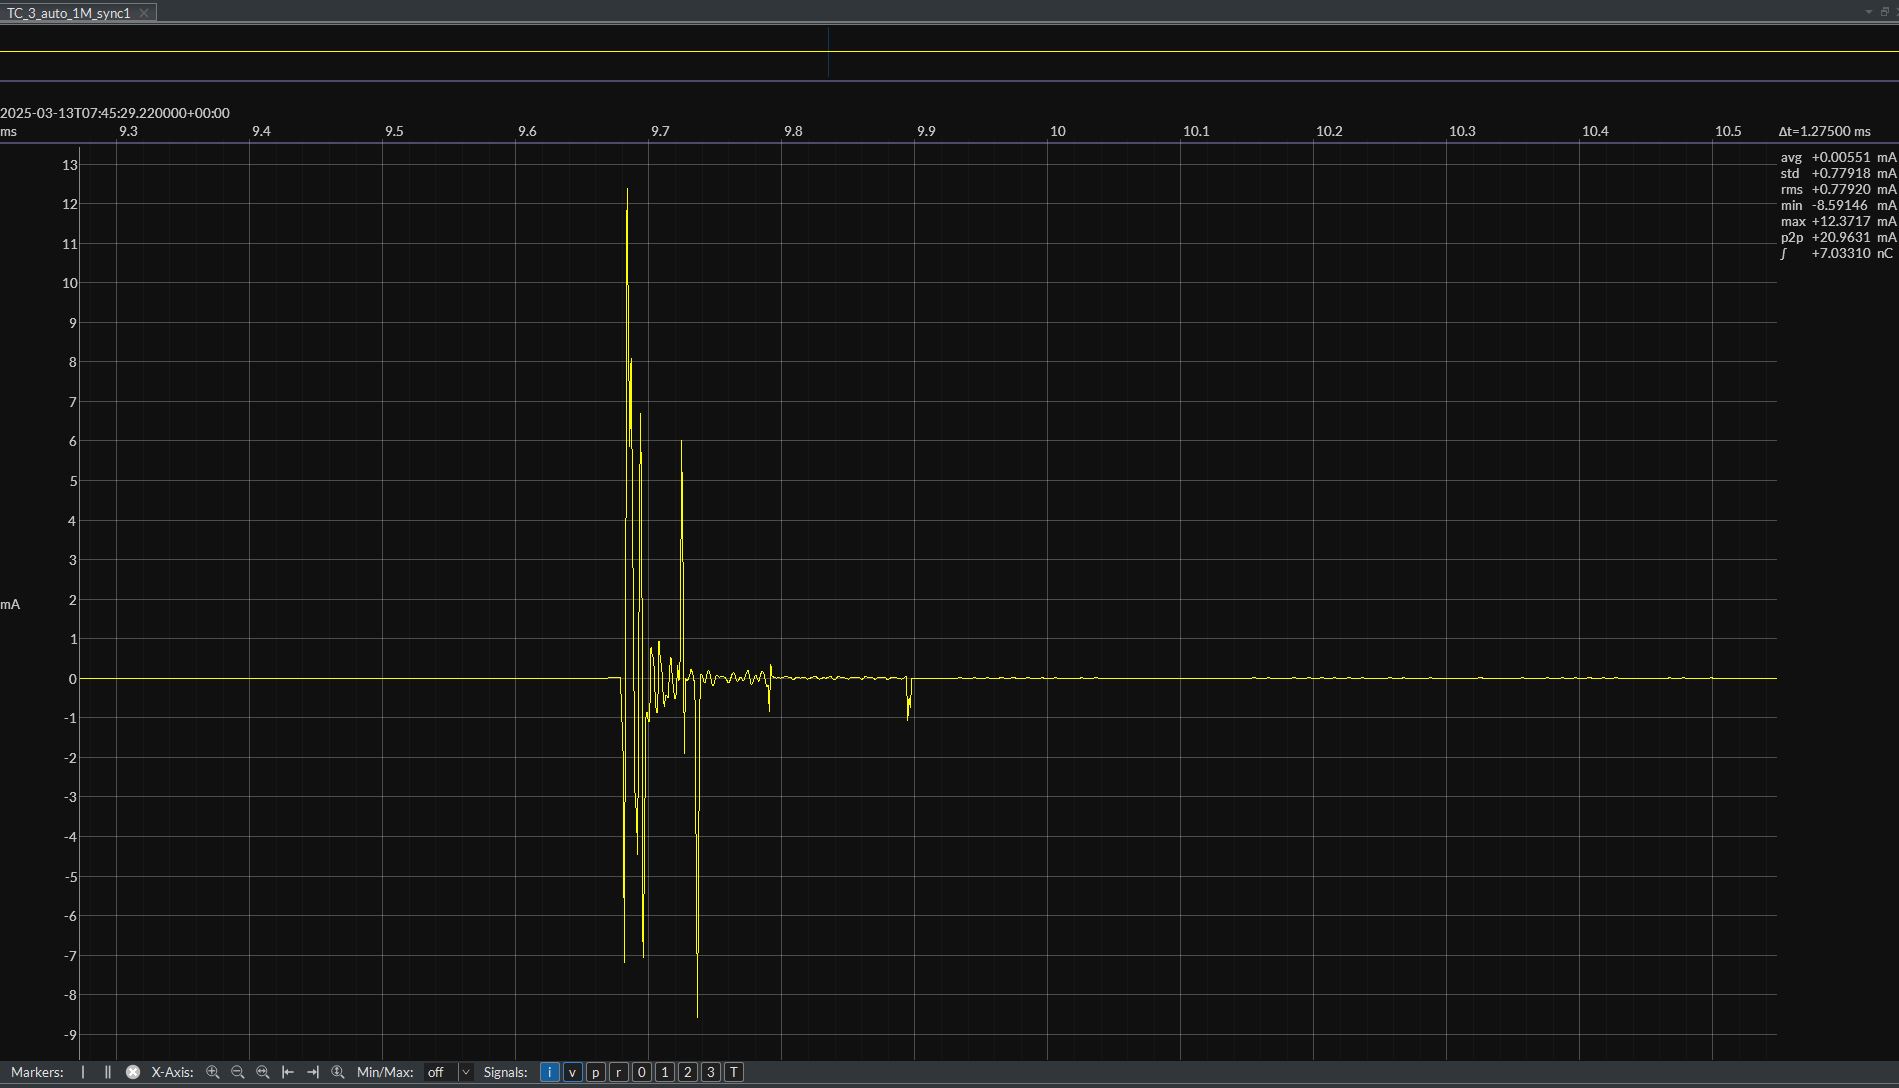
JS and PowerAnalyzer measurements are considerably off w.r.t. each other. Main difference is that the JS captures many samples with negative current during the wakeup-activity that I am not sure are actually there. We are expecting capacitor discharging when activity is off and system goes back to low-power mode but here we see quite some oscillation at the start of the ‘wakeup’ period.
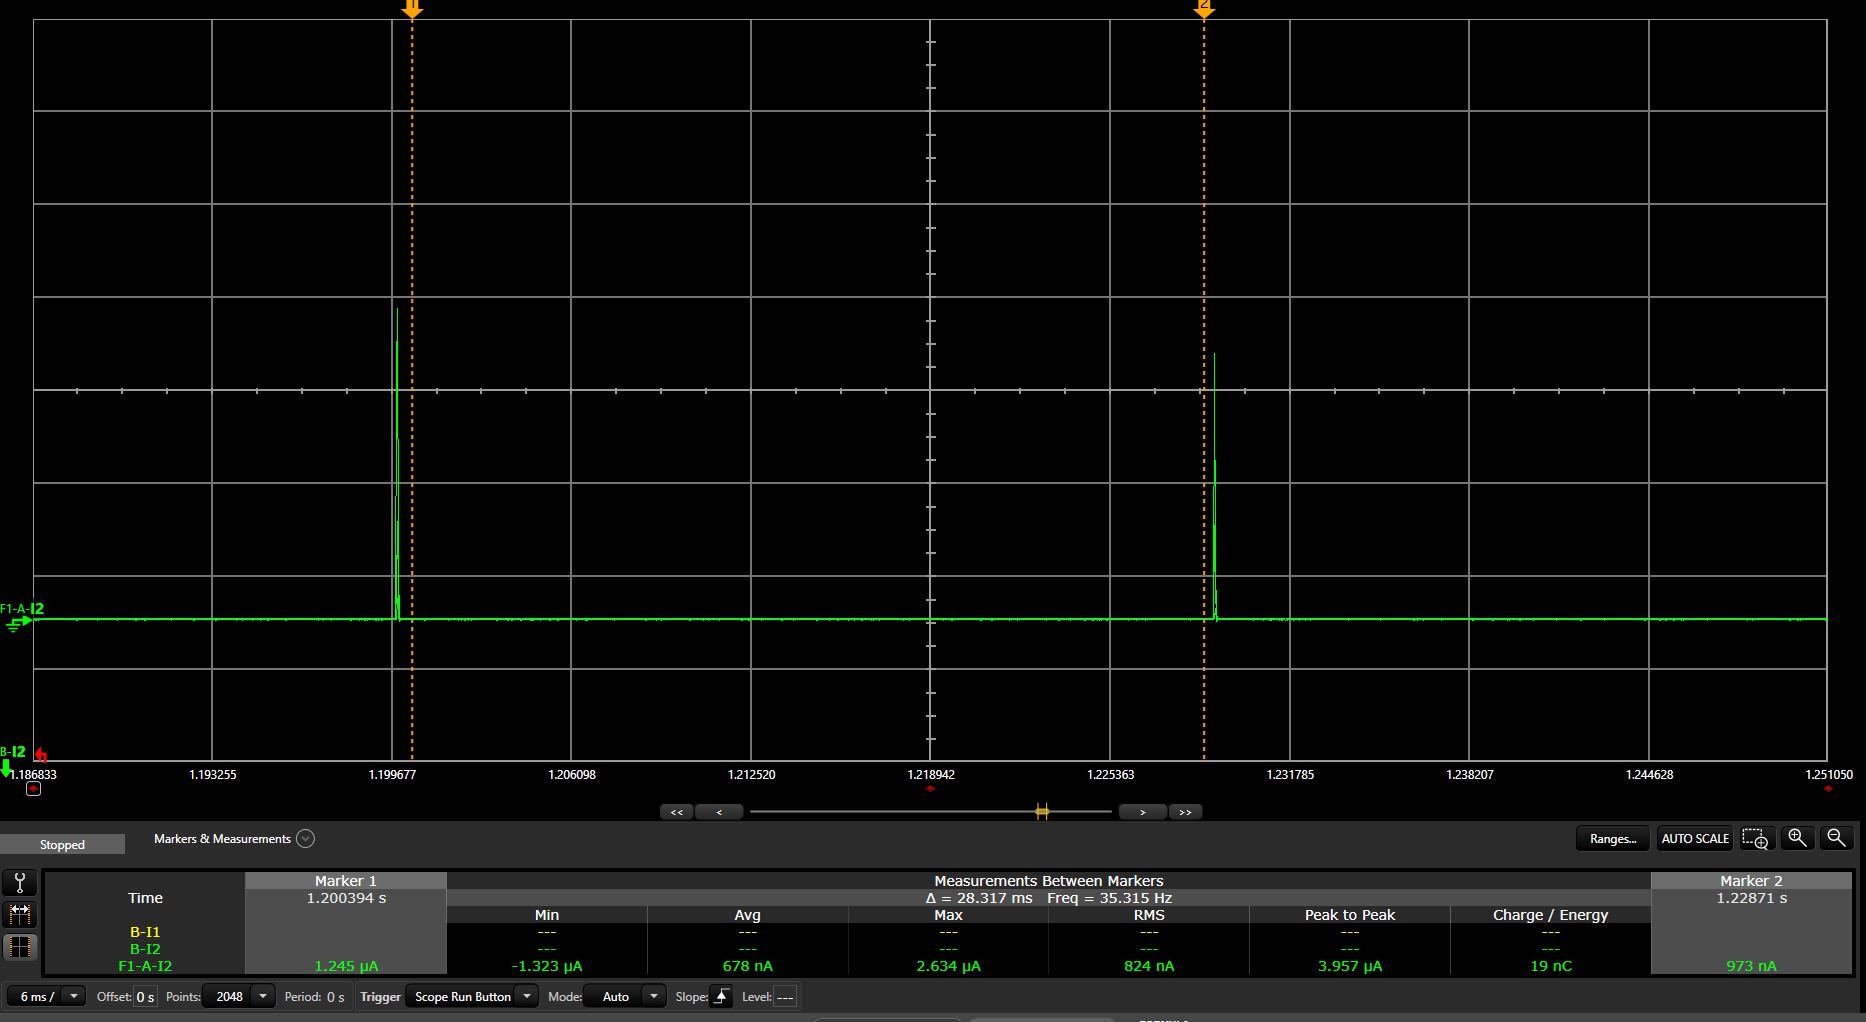
Attached you may find captures demonstrating the above, named *_event.jpg
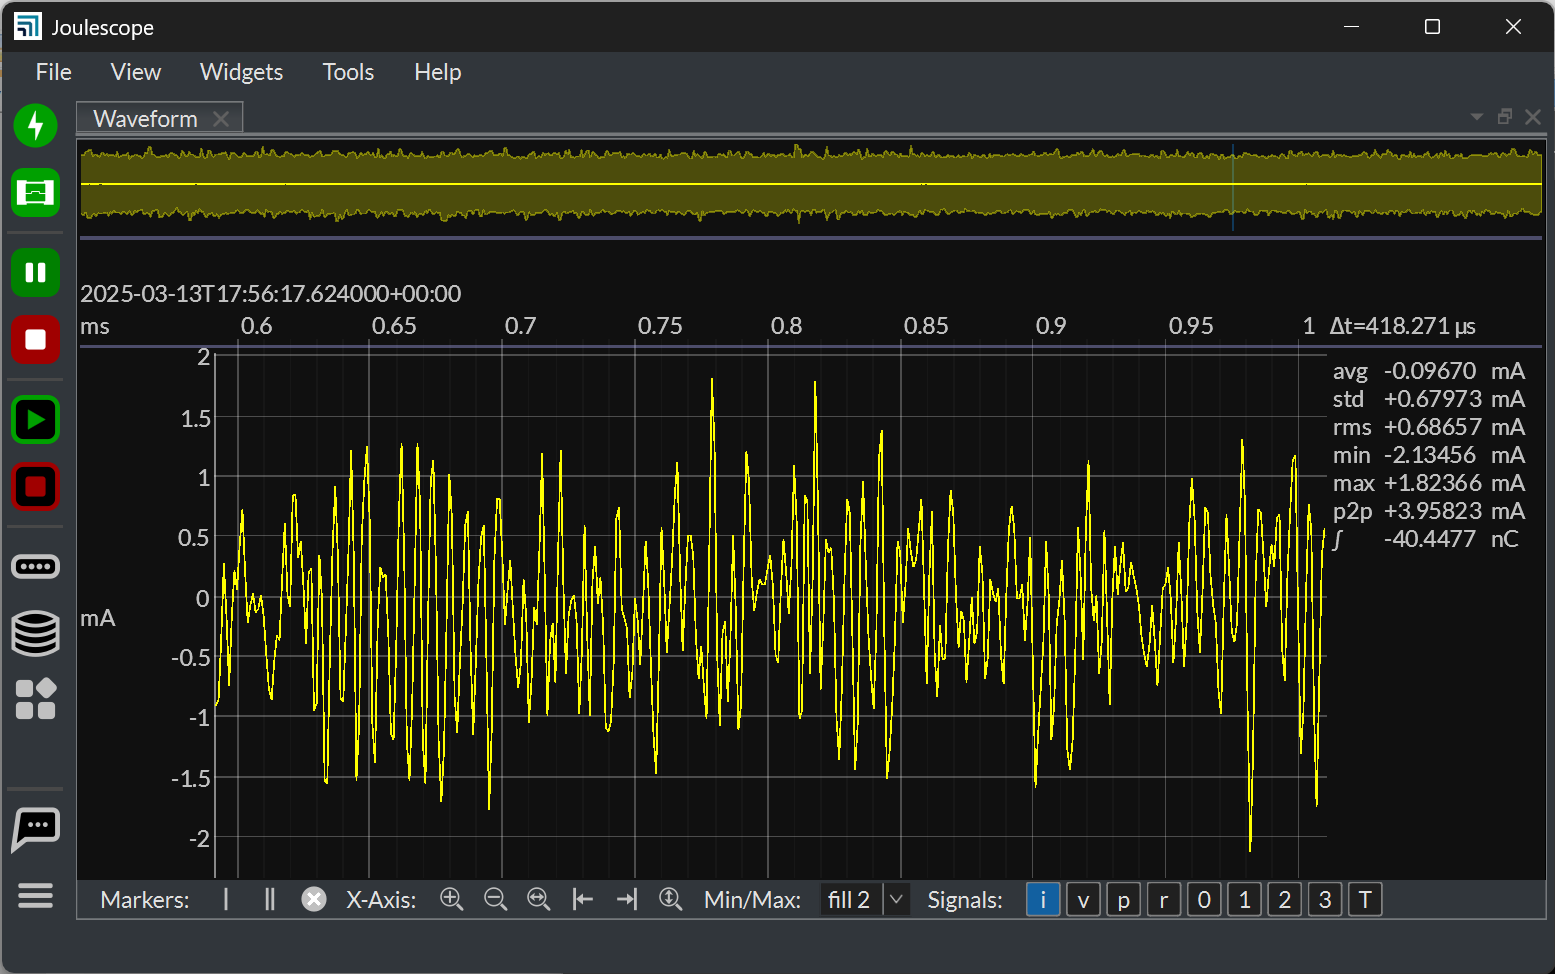
Also, I have captures for the period between the events, called *_sleep.jpg where you can see that in the sleep steady state both JS and PA measure very similarly at around 680 nA.
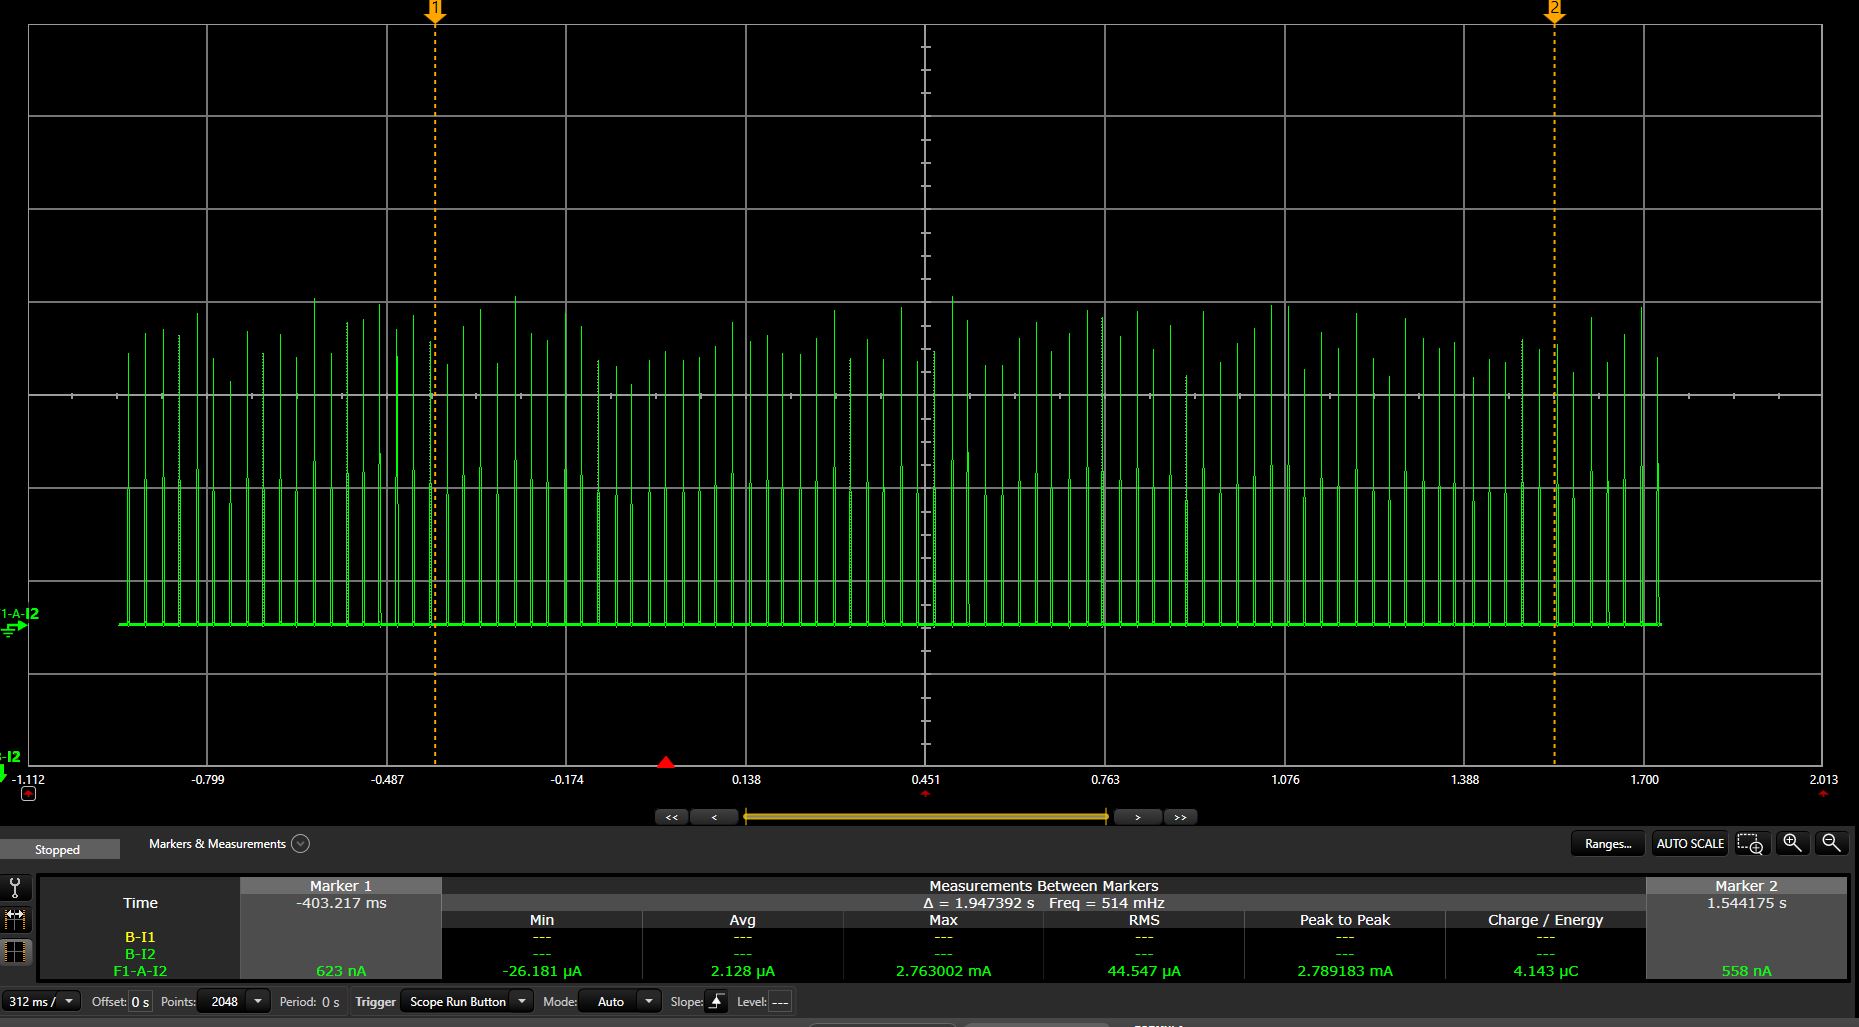
Finally, in the PA_overall.jpg capture you can see the statistics for the whole capture for PA (overall statistics for JS are in all the other snapshots). You can see that PA measures around 2.2 uA overall average current whereas JS shows 1.4 uA for the same measurement. This can have quite some impact in the battery lifetime of our products. P2P values also show what I am describing with JS presenting a very high p2p value due to the negative values captured.
We tried filtering with ‘sinc1’ filter but the UI (or JS) became unstable and kept on resetting every couple of seconds.
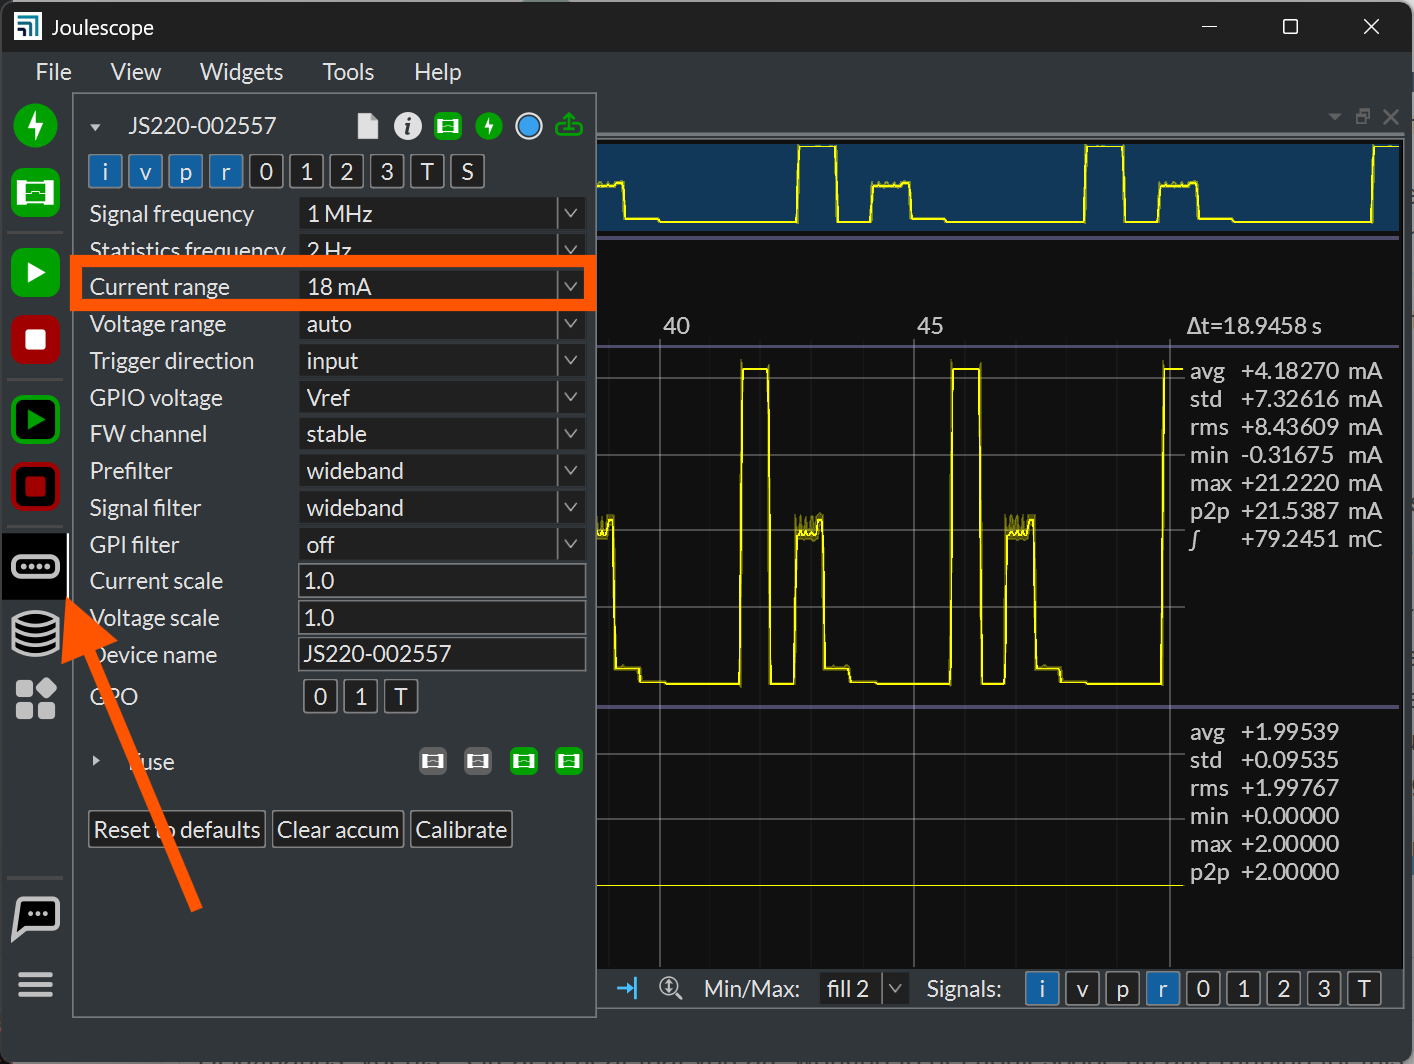
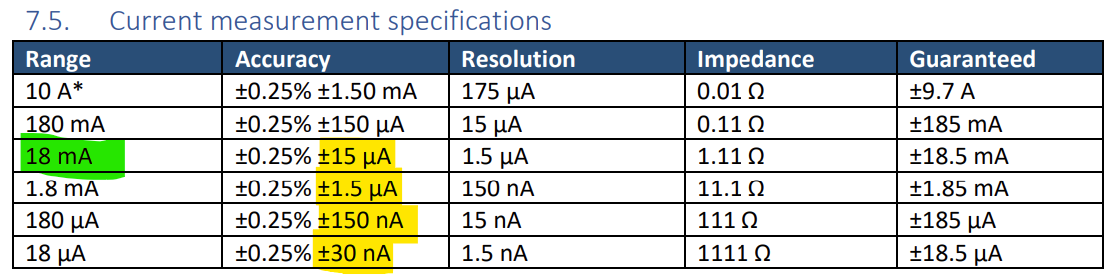
For our JS measurements we set max value for autoranging at 180 mA.
Please advise on how we can identify the truth and move forward. The thing is that we don’t know which instrument is right here, though JS oscillation and negative values at the start of the event are a bit suspicious to me.
Thanks very much in advance.
BR,
Thanos