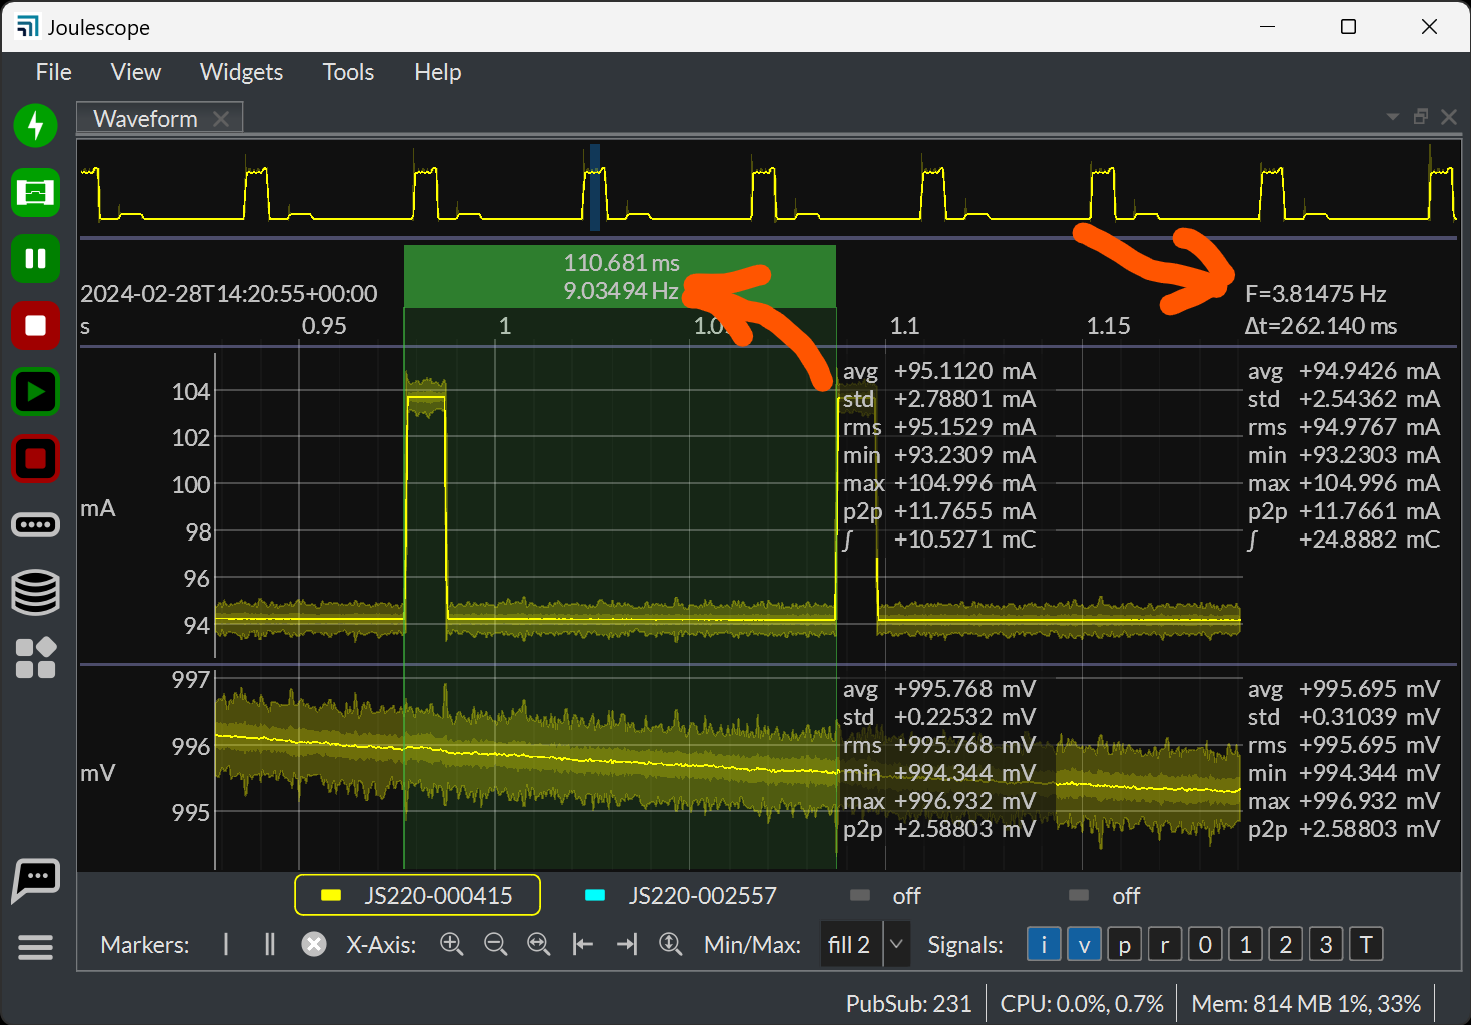
Probably more often than not, I use the dual cursors to determine the frequency of periodic events, especially when the time period is short. However, the frequency is not shown, only the period.
My feature request is to default to delta-t, but have a hotkey to toggle between delta-t and frequency. This might cause issues for you, though, since you have the same statistics for the window, where a frequency probably doesn’t make sense. An acceptable alternative would be to only apply the hotkey to the value between the flags (which, BTW, I would REALLY like to see moved upwards a bit including both flag values - so that they are never over the time axis labels, and they would also be easier to read when the flags are close together).
FYI, just downloaded 0.9.11. It seems like the dark blue ‘time window’, for lack of a better description, could be not so thick, and also not have the 'Time (seconds) label within it. If made thinner, there would be more room to accommodate the elevated cursor text.
Hi @wired, and thanks for the suggestions! Yes, we do plan to improve markers this year. Adding a frequency option should be doable. I am not sure about the hotkey, since it would need to affect every dual marker pair. What if you could turn on/off each potential statistic for each dual marker pair? Then, you could explicitly configure Δt and/or frequency display. Would that work for you?
#144 Add option for dual markers to display frequency
This definitely matches #36, and this is one possible solution.
The original idea for this summary “time window” was to display the full waveform in the buffer. We tried to implement this feature a long time back, but it hurt performance too much. However, we have made a lot of improvements to buffering since then, and we still plan to display a summary of the desired waveform here.
However, we do need to enable more customization for the size of items in the waveform view. Issue #73 is my current placeholder for this. Even if we do add the waveform summary “time window”, you should still be able to shrink or even hide it if it’s not important to you.
Hi @wired, and thanks for the suggestions! Yes, we do plan to improve markers this year. Adding a frequency option should be doable. I am not sure about the hotkey, since it would need to affect every dual marker pair. What if you could turn on/off each potential statistic for each dual marker pair? Then, you could explicitly configure Δt and/or frequency display. Would that work for you?
Yes, that could work, although there are probably many ways to work with statistics. I think the objective should be to not make it cumbersome to use during normal use. For example, a +f or a +d while hovering over a marker flag could set just one marker. Or, if you really wanted to get fancy with the marker system, you could allow the user to set up custom named marker configurations in the Preferences (maybe have some default setups), and be able to easily select which style you want any time after you drop the marker. Usability should be the prime consideration, but any way you can get a frequency to appear will make me happy. No, make that happier - I’m already very happy with the Joulescope!
Hi @mliberty ,
I also would like to add an feature request. I sometime deal with very long measurements and when I use the dual marker to see delta t, I have to make at least having both curser in a range that the delta t is still visible, when I use additionally the zoom. Would it be possible to fix the delta t view at the left or rigth side of the time scale when the measurement is moved further and at least one of the two cursers is still shown, or the zoomed section is within the dual markers. That would be great. (Could be also a setting within the preference to have it fixed or not.)
Hi @ps_Water, and thanks for the suggestion! Right now, Δt is displayed at the top and wherever the statistics text is displayed near either marker. As you zoom in, the markers and statistics text may not be in the visible time range, so they are not displayed. Also, the Δt top value is always centered, so it may also not be displayed.
I understand that you want to be able to see Δt even when zoomed in. I think that floating text without any context could be very confusing. The Δt at the top is already a bit unclear.
Right now, I am thinking about adding another widget, probably on the right-hand side, that would allow you to select and display any measurements you want. So for example, you would select Add measurement → Marker → 1 → Δt. We could also add this as a right-click option to the dual marker, so it could be Add measurement → Δt.
Hi @mliberty,
I agree that floating text will be confusing.
The ideas are nice. Both would be a good start. I love the idea of the separate widget. For this it would be also nice to add the single values to that widget and give it a bit more flexibility if it is fixed to the screen.
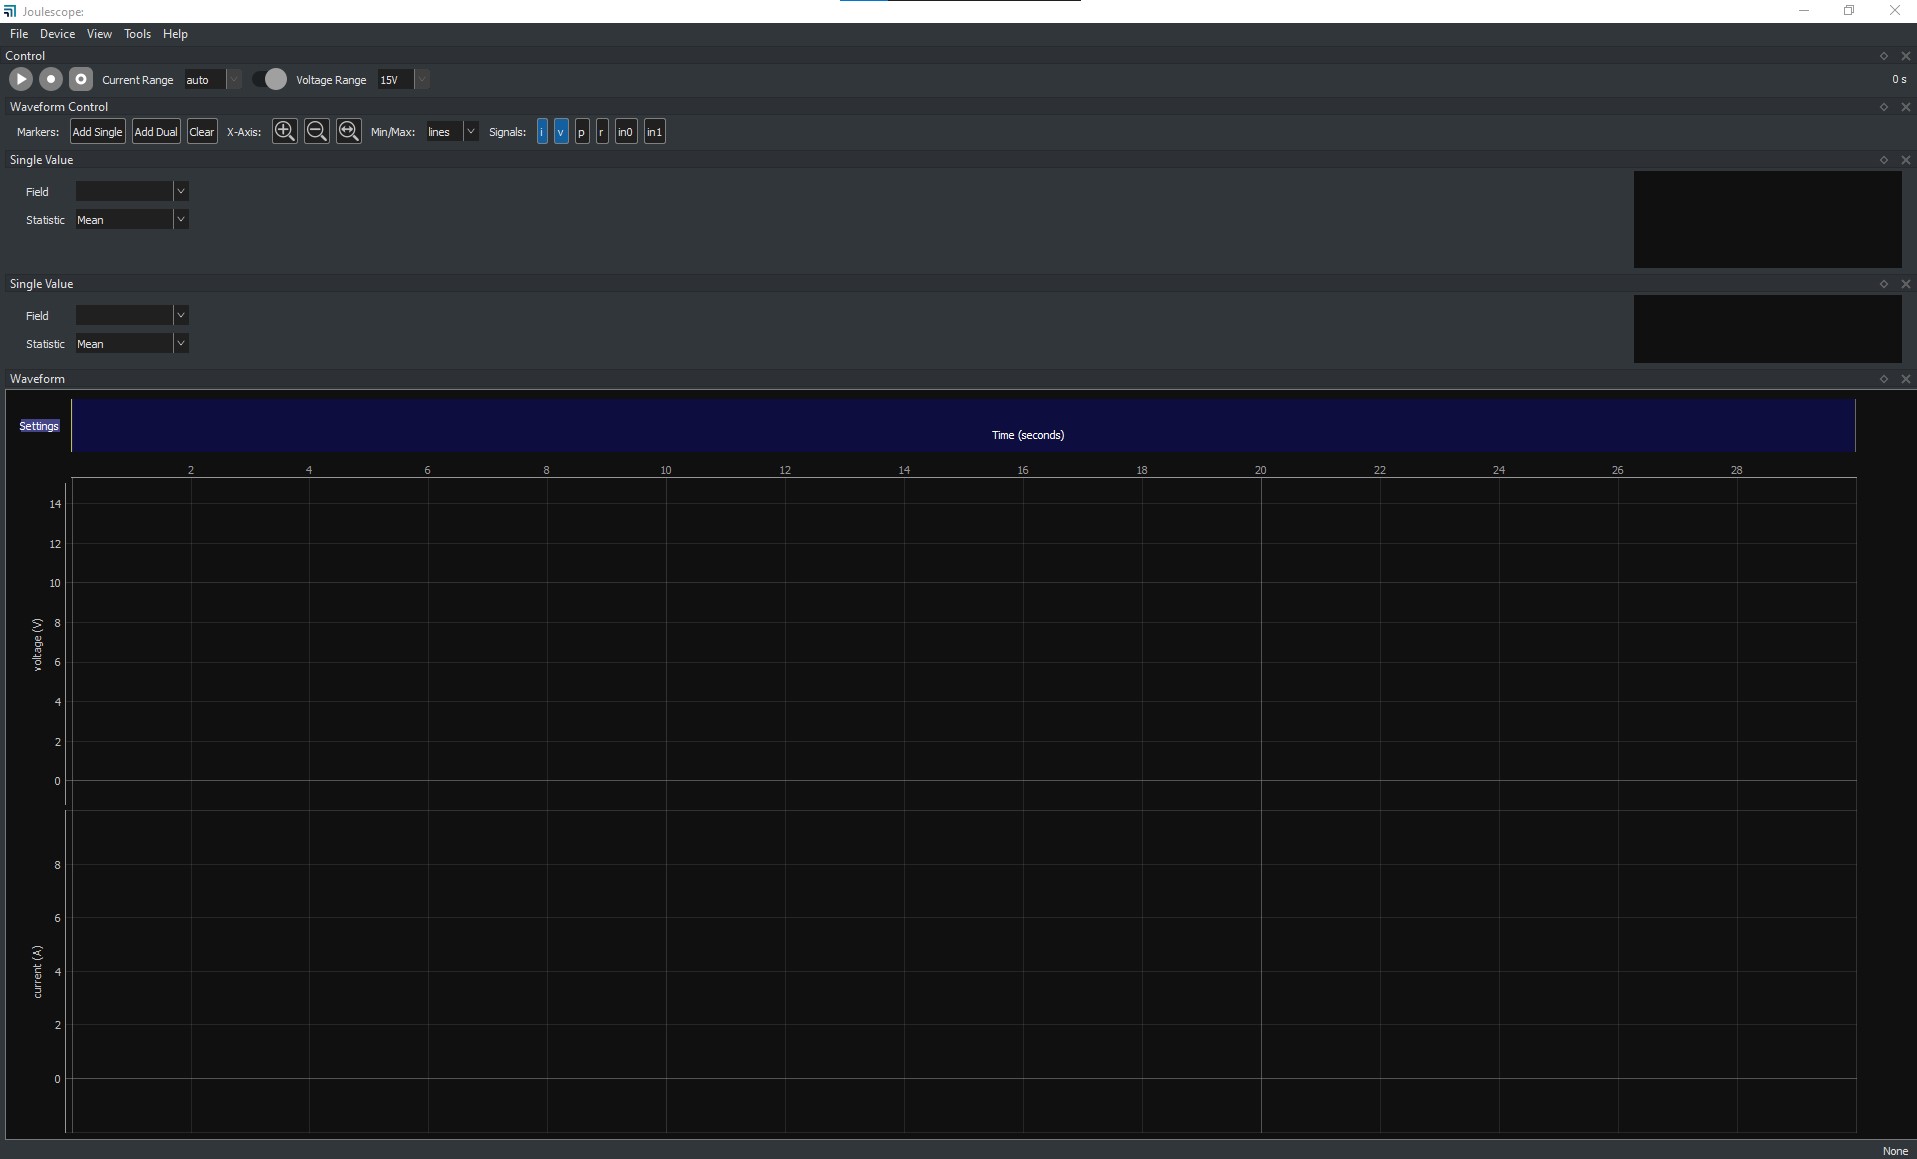
I configured my oscilloscope view as viewed within the picture below.
But so far I was not able to place the two Single Values beside each other to get a bit more height for the Waveform window it self.
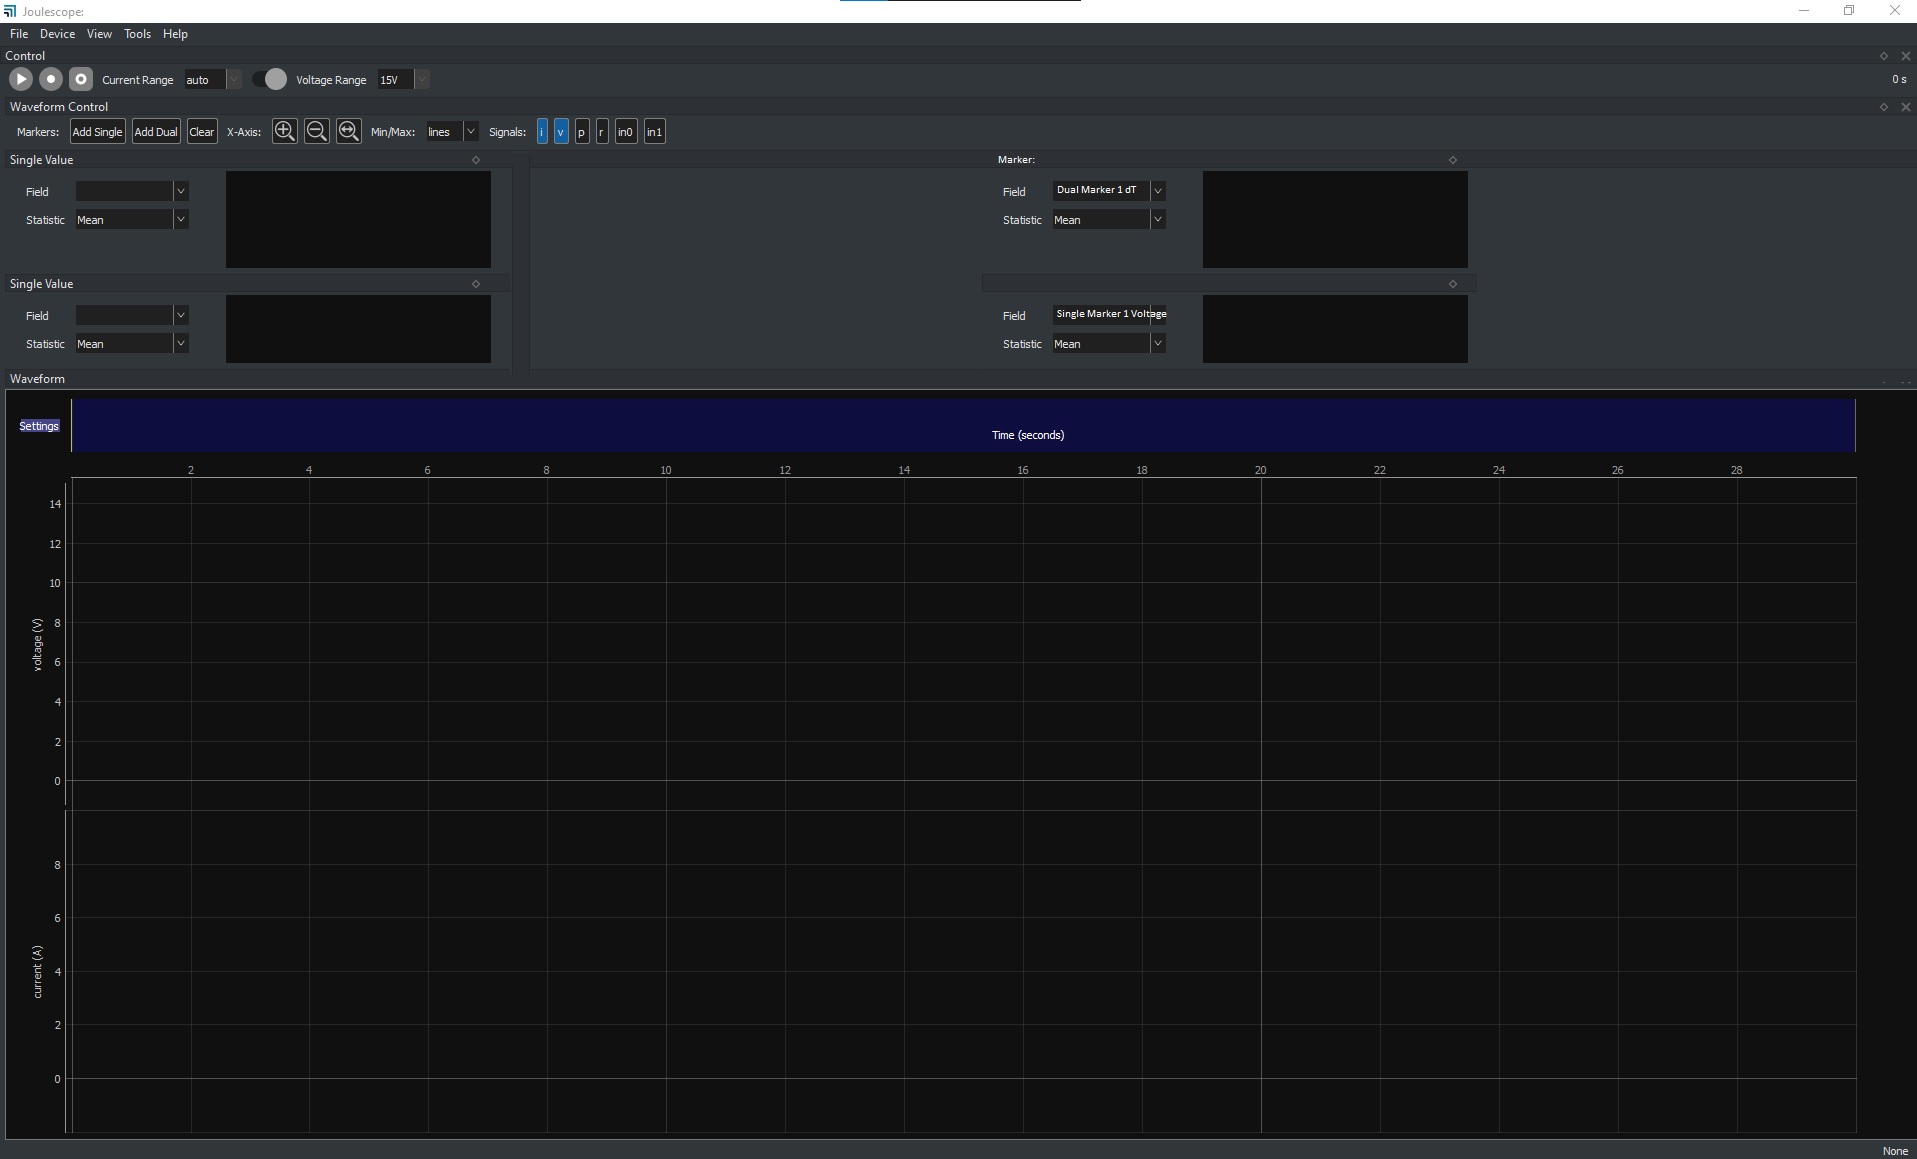
I also would like to place the new widget above the Waveform window to the right side. May be like the second attached picture.
Hi @ps_Water, and thanks for the mockup screen. Yes, the single value widget is currently constrained to only stack vertically, not side-by-side. We definitely want an option to make more efficient use of screen space for measurements including the values displayed by the single value widget.
This feature is on our list for the next major UI update, which is likely to be released this summer. Sorry it’s going to be so long, but we’ll get there! Thank you for taking the time to provide your feedback!
LOL! I think you would love the new UI which incorporates a lot of your feedback from years ago.
Thanks for taking the time to help us make a better product.