I hope all the data I’ve collected in the last few days doesn’t have to be thrown away.
Version 0.8.6:
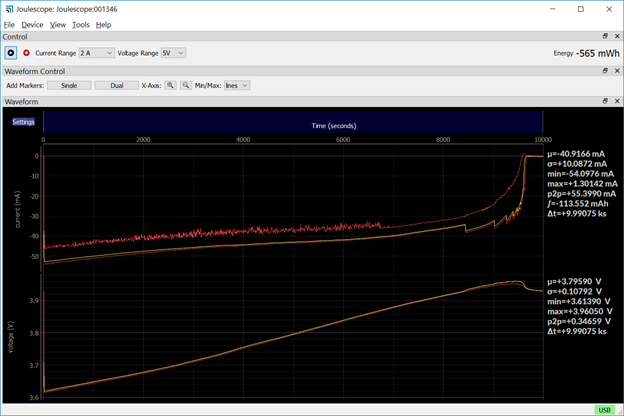
I ran a Charge test on my DUT, and was looking at the live data, being somewhat disappointed with the integrated charge 113mAh, shown in the statistics below:
I stopped the logging to file and copied it to take back to my desk to archive and to pull an image to put in a report.
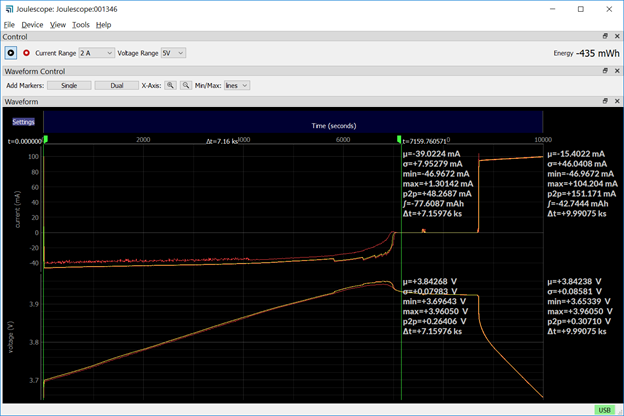
Over the same range range of the waveform, I now got this:
Yay! I like 151 mAh better than 113, but it’s over the same section of waveform! Note the sample count is 12500sec now. I then went back to the live session still running on my lab computer, and put cursors around the same range as previously, and got this, showing 77mAh, and 7600 seconds:
So, my delta-T keeps changing, and my integrated charge keeps going down the longer I am in session.
Now I’m wondering what is actually correct? Definitely not the live session. Am I misinterpreting what I’m seeing, or is there a major problem here? I will remain at 0.8.6 for the time being in case I need to do more investigation, but I am no longer confident in any data I have collected this week. It appears that the saved file has the correct time interval, based on I think I started and ended the test.
I don’t think that I entirely follow what you are seeing here. You have three images:
10,000 second RAM buffer
12,575 second file
10,000 second RAM buffer, approximately 2841 seconds after (1).
RAM buffers are limited in duration. Old data moves offscreen and is forgotten (except for the total charge / energy displayed in the multimeter, single value dispaly and control widget).
I think you are saying that the charge over all of (1) and the charge over dual markers in (3) should be the same. If I understand correctly, 2841 seconds have moved off screen and are not accounted for in (3). I would not expect these to be the same.
I also think that (1) is missing about 2000 seconds of data that you care about in (2).
So, my conclusion is that all waveforms are correct. Here is how you can prove it to yourself. In (2), move that left-hand marker to match the total duration in (1). Does the charge now match? You likely have a small mismatch in the time after the “end event” that will cause some error since the left hand side will not exactly align. You can then repeat to try to measure the 7160 seconds in (3) in the (2) waveform.
I also think that (2) is the only image that captures your entire cycle. If you dual markers are exactly spanning the region of interest, then they should be computing your charge of interest.
I see what you’re saying. I think what was throwing me off is that there are vertical artifacts at the beginning of the plot area that are not consistent with the data shown in the 2nd image, which is the logged data. I was mistaking these artifacts for the beginning of the charge cycle. What is causing these artifacts, as you can see that there are no significant step changes in the waveform corresponding to those artifacts if you look at the complete waveform in the 2nd image?
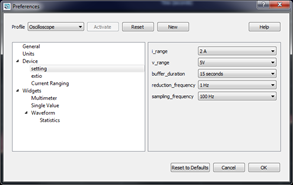
I am not sure, but I can investigate. I don’t see any drawing artifacts like that in a quick test at 10 kHz. What is your sampling_frequency set to? 100 Hz?
I collected some data, but I have not been able to duplicate this behavior yet. I can think of two potential causes for this artifact:
The screen pixel data is incorrectly computed.
The graphics are not displaying correctly. (mostly likely not redrawing over old data)
I have a quick test that will help. If you see this artifact again, could you try zooming into the middle of the dataset (around 5000) once. Does the artifact remain? If so, try resizing the window. Does the artifact remain? Either way, zoom back out. Is the artifact gone? The results of this will help me determine if (1) or (2) is the underlying cause. In the meantime, I will continue to try to duplicate this issue.
I no longer have that dataset up, because I had to do more testing today, but if I recall correctly, the artifact remained when zooming in and out. I did not try resizing the window. If I encounter this again I will try your recommended tests.
Hi @wired I have been trying to duplicate this issue, and have not been able to so far. I have also been testing with 0.8.9, not 0.8.6.
If the issue was (1), I would think that I would have seen it. The underlying behavior of (1) is pretty consistent and other than better NaN handling, not much changed from 0.8.6 to 0.8.9. That leaves (2), which means potential issues with a bunch of code and libraries. 0.8.9 did update some libraries from 0.8.6, too. I’ll keep an eye out. If you see it again, let me know what you find with the resize window test. Thanks!