There seems to be some kind of display artifact in the upper-left corner of the time scale.
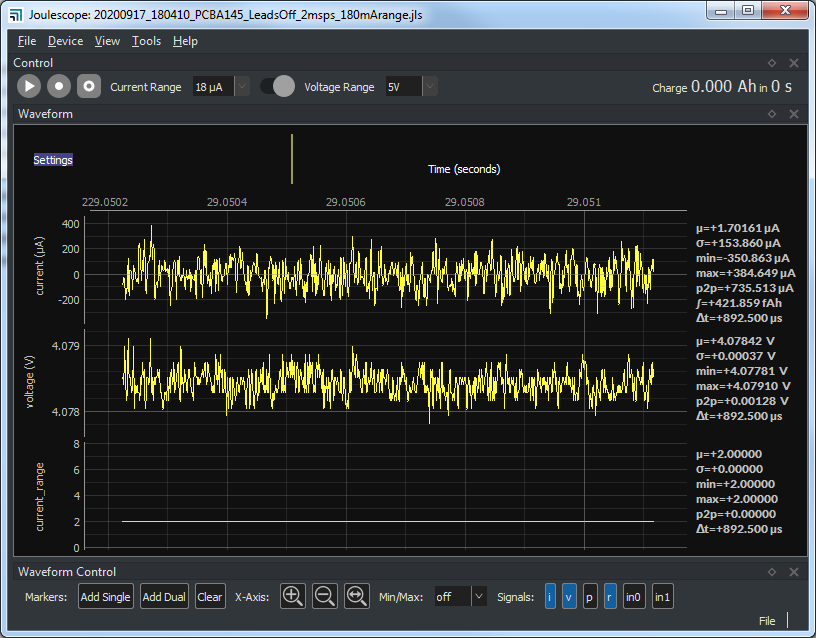
There is a portion of the left-most displayed value that is not getting updated/removed, and when I pan the plot by holding the left mouse button, or by zooming, I can create a value like the one shown above or the one shown below.
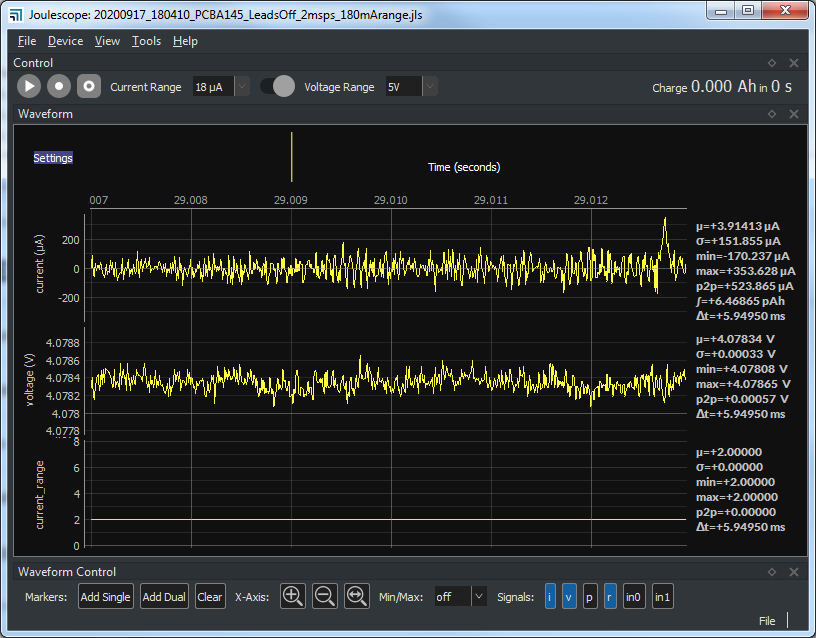
It remains while the cursor is on the plot window, but gets corrected when I move the cursor outside the window.
Not a huge deal, but as you can see it does survive the Ctrl-Alt-Prtscr operation, so could inadvertently get included in a report.