Hi sir,
i notice change in magnitude of signal, when i hold the cursor moving left/right of the UI screen with mouse.
can i avoid this.
please let me know why the signal is behaving like this.
Hi sir,
i notice change in magnitude of signal, when i hold the cursor moving left/right of the UI screen with mouse.
can i avoid this.
please let me know why the signal is behaving like this.
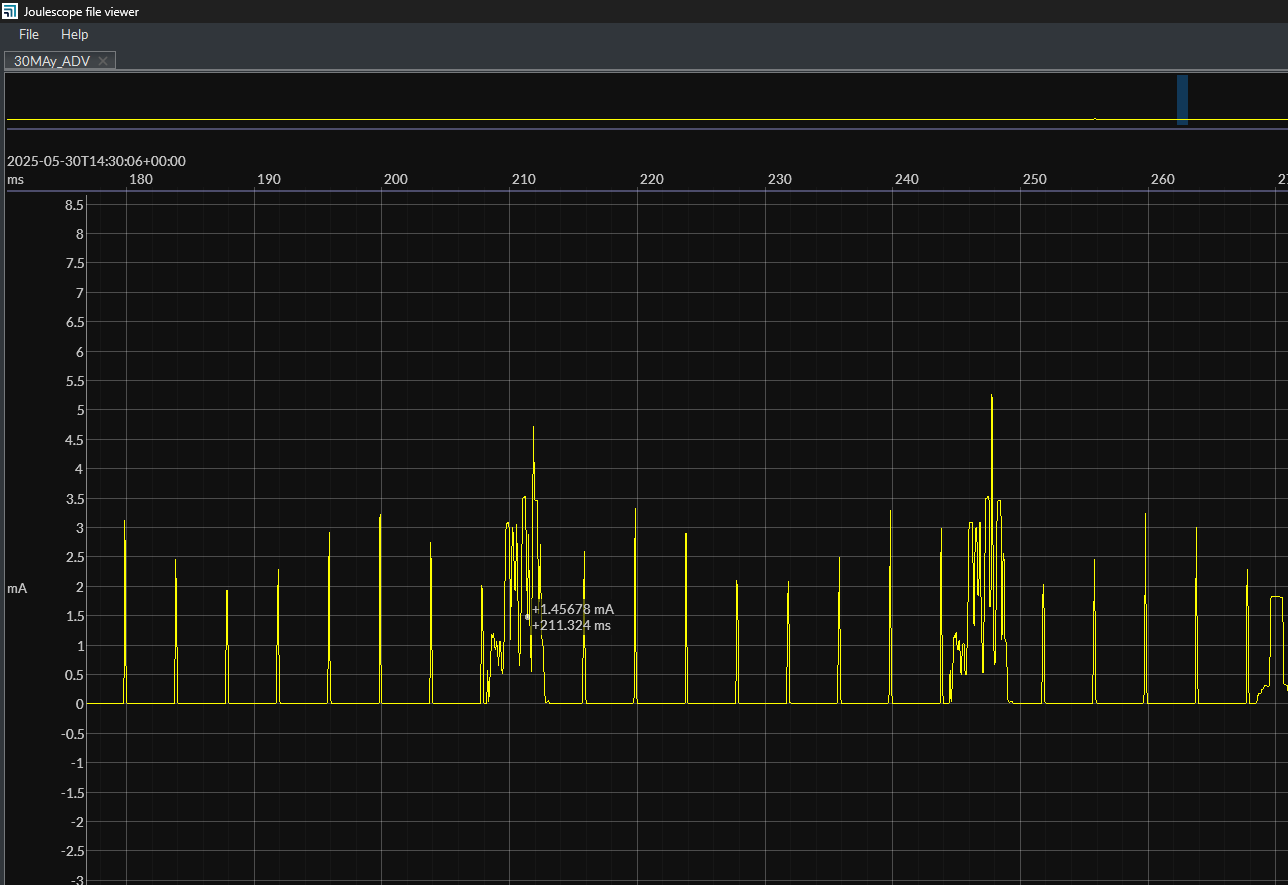
Hi @NGS - Are you concerned about the the hover value changing when you pan the waveform left and right, like this:
When the waveform is zoomed out like this, each pixel represents many samples. As you pan left and right, the samples in a given pixel at the “same” waveform time can change. If you look closely, you notice that time is changing, too, which explains why the value changes. This effect is much more noticable around sharp edges, as shown above.
If you zoom in to the sample level, the value remains constant, as expected:
The underlying samples are not changing, and the waveform is still correct when panning. What changes is the how the samples get binned into pixels. The UI does not constrain zoom levels to some sample modulus and interval, which is not possible due to time synchronization, either.
Single markers have this exact same effect, since they do the same thing as the hover value.
If you want constant value as you pan, use dual markers. Dual markers are fixed to start/stop UTC time, not to pixels, so the sample range is fixed.
hi sir
Good afternoon, sorry for late reply…
yes you are right ,
hover value is changing when i pan the waveform left and right,
added dual markers to the plot , noted the average is not changing when panned , even visual magnitude is changing when panning left/right.(as you mentioned, it is not changing when zoom in and doing pan).
Thank you very much sir,
my query is cleared.