Hello
I was wondering if this processor requirements is normal
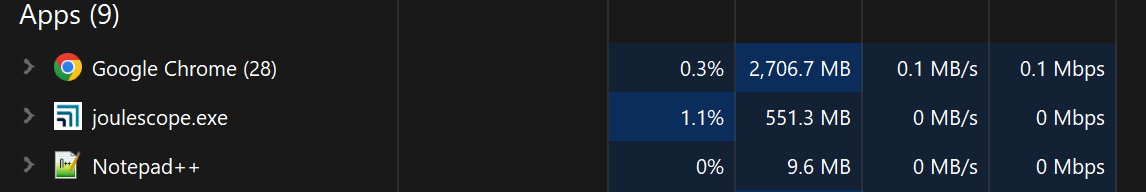
I have an I7 11th generation, and 32gb of RAM, I guess that 15% of the CPU is a lot.
Any configuration can get this to a lower number?
Regards
Maximiliano
Hello
I was wondering if this processor requirements is normal
I have an I7 11th generation, and 32gb of RAM, I guess that 15% of the CPU is a lot.
Any configuration can get this to a lower number?
Regards
Maximiliano
Hi @maxicor88 - that does seem higher than I would expect. However, it really depends upon your configuration and what you are doing with the Joulescope UI at the time.
If you are looking to reduce this, can you share more information?
%LOCALAPPDATA%\joulescope, select all subdirectories, and delete. Start the Joulescope UI.When streaming data in the Waveform view, remove markers to reduce processing.
With a Joulescope JS220 and Joulescope UI 0.10.13, if I revert to the default configurations, launch the Joulescope UI, then select View → Oscilloscope, I see:
CPU seems to range from 0.4% to 2.1%.
The computer is an i9-13900K, Asus PRIME-790A motherboard, 64 GB RAM, running Windows 11.
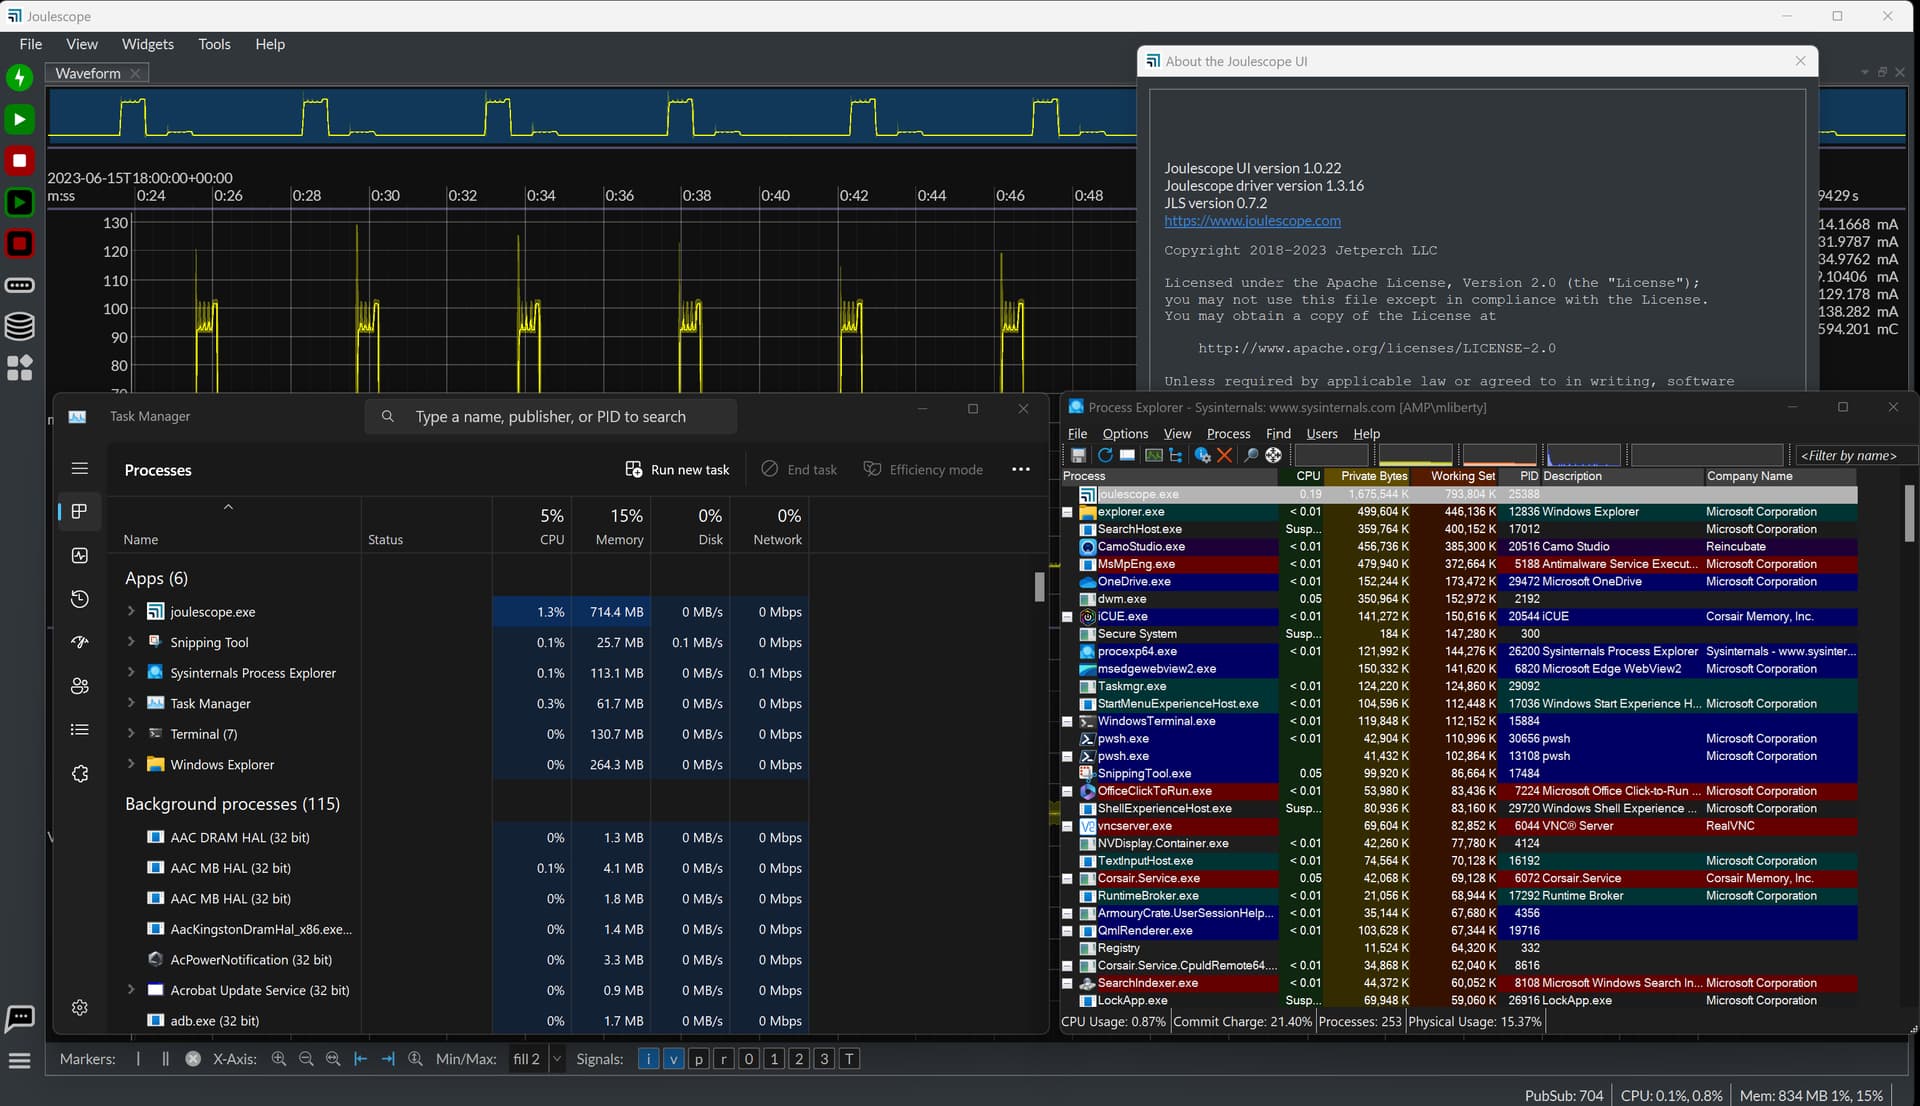
The new Joulescope UI 1.0 should have much lower CPU utilization than 0.10.x. Here is what I see:
I recently learned the Task Manager is not accurate since it does not account for CPU clock scaling. Process Explorer is more accurate as it represents the percentage of the capacity and full clock rate.
Measurements were taken on: