Question from Jeremiah Gillis over on Kickstarter:
Is the USB Inrush tool supposed to be grayed out on 0.4.1? I am unsure how to activate it.
1 Like
Hi Jeremiah!
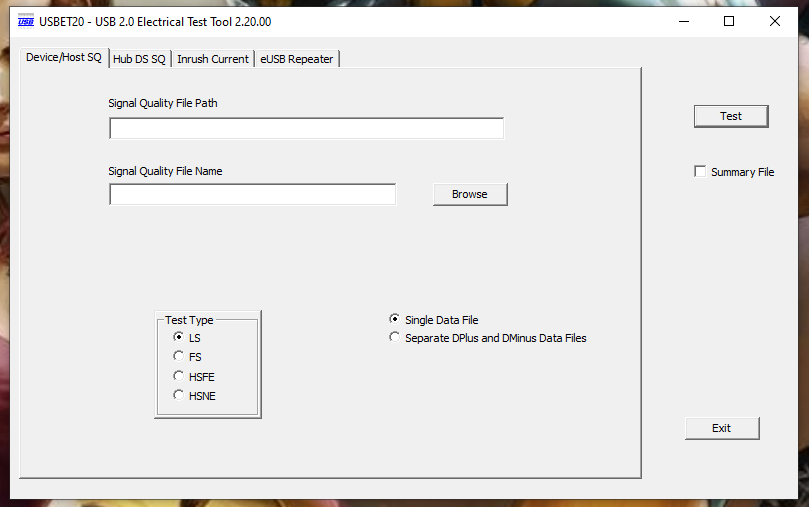
I have not yet documented how to use the USB inrush tool, so I’m not surprised that it is confusing. The USB inrush tool depends upon the official USBET20 from the USB-IF. USBET20 only runs on Windows, so the Joulescope software only supports USB inrush testing under Windows. First, download USBET20 from the USB-IF, then install it to the default path on your computer. You can then use the Joulescope software to collect and analyze data:
- Install the USB Front Panel (or use some other way to route USB current through Joulescope)
- Launch the Joulescope UI
- Click Tools and verify that USB Inrush is not grayed out
- Select View → Oscilloscope
- Select Current Range → off
- Connect the IN USB port to your host computer
- Connect the OUT USB port to your target device
- Ensure that the oscilloscope is streaming live data
- Select Current Range → 10 A
- Wait for a second (you only need 100 ms of data)
- Click Play button to stop live streaming
- Pan and zoom, until your desired range (at least 100 ms, but likely not more than 200 ms) is displayed onscreen. (now that the software has dual markers, I should add support there!)
- Click Tools → USB Inrush
- Wait for USBET20 to launch Internet Explorer (for realz) to display the results. While the browser is open, you can navigate to the directory and copy out the data if you want.
- Close Internet Explorer
The official USBET20 test is normally performed with USB20CV. If you find that your device is failing because your computer is initializing it, then run USB20CV and its special USB stack on either another computer or a different root hub of the same computer.
Please reply if you have any questions or run into any issues. I intend to integrate this post into the Joulescope User’s Guide, so I really appreciate your feedback!
1 Like
Thank you Matt. I will try this out when I get a chance.
Matt,
I get a “page cannot be displayed” error once IE opens. And the “temp/xxx” folder does not exist. Do I need to do anything to configure the USBNET tool?
Hi @anven and welcome to the forum! I don’t think that you should need to do anything special. The Python code creates that temporary folder, which should start with a “js_” prefix. The USBET is directly opening IE to that folder, so USBET is running. If you start the USBET tool on its own, does it run? If you can locate the “js_” temporary directory, you can also try providing the “inrush.csv” file directly to the USBET tool on the “Inrush Current” tab.
The Joulescope UI code to launch the USBET tool is pretty simple. On my machine, USBET does not return until you close Internet Explorer. If for some reason USBET closes immediately after calling Internet Explorer, then python would erase the temporary directory which would explain the behavior that you see. I could change this code to use a fixed, permanent directory rather than a temporary directory if this is the problem.
Thank you - that was it. I had a rogue instance of IE open and hiding in the task bar. Closing IE first solved the problem.
1 Like
@mliberty I am back to testing USB inrush. I have USBET20_2_20_00 x64 installed along with Joulescope 0.9.11. There is no option in the Tools menu or any other menu for USB inrush testing.
I did try USBET x86 which did not change the outcome. I also tried Joulescope 0.9.10 but could not make the program run. I had some sort of side by side error when trying to run Joulescope. I even cleared out my AppData folder for Joulescope.
How do I make this work?
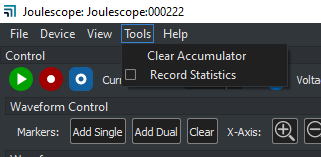
Hi @Jeremiah - Sorry for the confusion. We moved this feature from the Tools menu. You now have to add dual markers over the region of interest, which must contain the inrush current event and at least 100 ms of additional data. For example, select 135 milliseconds with 10 ms before the inrush event and 125 milliseconds after the inrush event. Then right-click on one of the dual markers, then select Analysis → USB Inrush. Does this work for you?
Yes, that is fine. It would be nice to have some basic instructions in the User Guide. At least knowing that some tools are accessed through dual markers → context menu → Analysis.
One thing to note here for anyone else is that Joulescope requires that USBET be x86, not x64. I tried switching back to x64 and the menu option disappeared.
Hi @Jeremiah - You are right about the x86 version support only. The code uses this hard-coded path.
I created issue #163.
1 Like